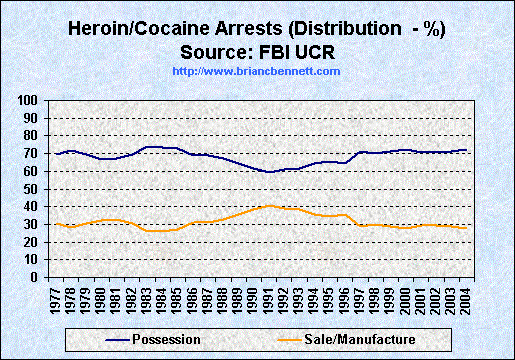
Trends in Heroin/Cocaine Arrests
Distribution by Offense Type (1977 - 2004)

Source: FBI Uniform Crime Reports
| Heroin/Cocaine Arrests: Number and Distribution of Arrests (1977 - 2004) | ||||||
|---|---|---|---|---|---|---|
| Possession Arrests | Sales/Manufacture Arrests | |||||
| Year | Heroin/Cocaine Arrests | % of Drug Law Arrests | Number | % of Heroin/Cocaine Arrests | Number | % of Heroin/Cocaine Arrests |
| 1977 | 84,836 | 13.2 | 59,128 | 69.7 | 25,708 | 30.3 |
| 1978 | 82,988 | 13.2 | 59,727 | 72.0 | 23,262 | 28.0 |
| 1979 | 68,149 | 12.2 | 47,481 | 69.7 | 20,668 | 30.3 |
| 1980 | 70,289 | 12.1 | 47,053 | 66.9 | 22,655 | 32.2 |
| 1981 | 72,227 | 12.9 | 48,711 | 67.4 | 23,516 | 32.6 |
| 1982 | 115,596 | 17.1 | 80,444 | 69.6 | 35,152 | 30.4 |
| 1983 | 152,783 | 23.1 | 113,099 | 74.0 | 39,684 | 26.0 |
| 1984 | 184,892 | 26.1 | 136,013 | 73.6 | 48,171 | 26.1 |
| 1985 | 239,363 | 29.5 | 174,451 | 72.9 | 64,912 | 27.1 |
| 1986 | 336,233 | 40.8 | 231,572 | 68.9 | 104,661 | 31.1 |
| 1987 | 427,454 | 45.6 | 295,281 | 69.1 | 132,173 | 30.9 |
| 1988 | 599,549 | 51.9 | 403,165 | 67.2 | 196,384 | 32.8 |
| 1989 | 732,595 | 53.8 | 472,510 | 64.5 | 260,085 | 35.5 |
| 1990 | 591,599 | 54.3 | 745,218 | 61.3 | 228,795 | 38.7 |
| 1991 | 558,530 | 55.3 | 331,280 | 59.3 | 227,250 | 40.7 |
| 1992 | 565,192 | 53.0 | 345,514 | 61.1 | 219,678 | 38.9 |
| 1993 | 566,529 | 50.3 | 350,279 | 61.8 | 216,250 | 38.2 |
| 1994 | 501,369 | 37.1 | 409,474 | 64.3 | 227,035 | 45.3 |
| 1995 | 627,343 | 42.5 | 410,356 | 65.4 | 216,987 | 34.6 |
| 1996 | 599,468 | 39.8 | 385,587 | 64.3 | 213,880 | 35.7 |
| 1997 | 565,345 | 35.7 | 402,234 | 71.1 | 163,111 | 28.9 |
| 1998 | 570,631 | 36.6 | 399,130 | 69.9 | 171,501 | 30.1 |
| 1999 | 527,857 | 33.9 | 375,261 | 71.1 | 152,596 | 28.9 |
| 2000 | 529,155 | 33.5 | 382,255 | 72.2 | 146,900 | 27.8 |
| 2001 | 520,504 | 32.8 | 366,574 | 70.4 | 153,929 | 29.6 |
| 2002 | 463,183 | 30.1 | 327,767 | 70.8 | 135,416 | 29.2 |
| 2003 | 508,492 | 30.3 | 360,811 | 71.0 | 147,681 | 29.0 |
| 2004 | 530,696 | 30.4 | 384,057 | 72.4 | 146,640 | 27.6 |
| Grand Totals: | 11,527,987 | 36.5 | 7,762,018 | 67.3 | 3,764,679 | 32.7 |
Note: Possession vs sales distribution data not available before 1977