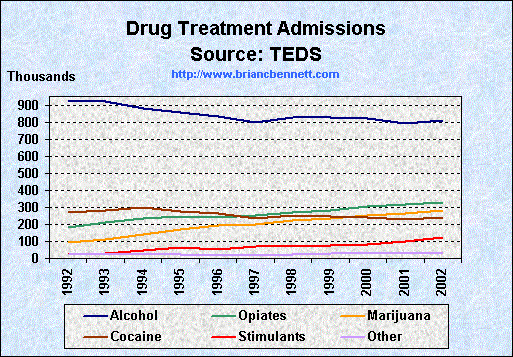
| Distribution of Drug Treatment Admissions - Major Drugs | ||||||||
|---|---|---|---|---|---|---|---|---|
| Year | Total | Alcohol | Opiates | Marijuana | Cocaine | Stimulants | Other Drugs | None Reported |
| 1992 | 1,560,311 | 924,660 | 184,041 | 92,518 | 270,573 | 22,133 | 21,153 | 45,233 |
| 1993 | 1,618,597 | 921,029 | 210,008 | 111,418 | 281,736 | 28,931 | 21,348 | 44,127 |
| 1994 | 1,671,039 | 882,480 | 232,063 | 142,906 | 297,408 | 45,181 | 21,592 | 49,409 |
| 1995 | 1,680,697 | 858,287 | 244,110 | 171,344 | 278,421 | 63,244 | 21,040 | 44,251 |
| 1996 | 1,643,731 | 832,844 | 240,971 | 192,918 | 263,896 | 52,964 | 19,452 | 40,686 |
| 1997 | 1,607,957 | 796,674 | 251,417 | 197,840 | 236,770 | 68,166 | 18,942 | 38,148 |
| 1998 | 1,712,268 | 828,252 | 267,010 | 220,173 | 254,365 | 71,356 | 21,718 | 49,394 |
| 1999 | 1,729,878 | 826,610 | 280,345 | 232,407 | 243,697 | 73,631 | 26,879 | 46,309 |
| 2000 | 1,778,352 | 823,346 | 302,500 | 251,549 | 241,511 | 84,214 | 31,392 | 43,840 |
| 2001 | 1,788,646 | 793,008 | 316,373 | 265,242 | 231,386 | 100,996 | 33,611 | 48,030 |
| 2002 | 1,882,584 | 807,939 | 331,272 | 283,527 | 241,699 | 126,063 | 30,530 | 61,554 |
Source: Treatment Episode Data Sets (2004)