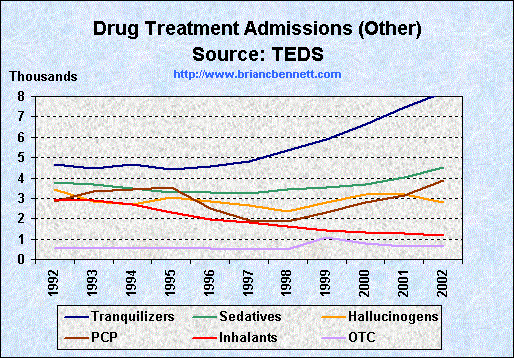
| Distribution of Drug Treatment Admissions - "Other" Drugs | |||||||
|---|---|---|---|---|---|---|---|
| Year | Total | Tranquilizers | Sedatives | Hallucinogens | PCP | Inhalants | OTC |
| 1992 | 1,560,311 | 4,656 | 3,758 | 3,452 | 2,835 | 2,922 | 522 |
| 1993 | 1,618,597 | 4,459 | 3,704 | 2,859 | 3,331 | 2,883 | 527 |
| 1994 | 1,671,039 | 4,661 | 3,480 | 2,689 | 3,442 | 2,676 | 583 |
| 1995 | 1,680,697 | 4,399 | 3,293 | 3,040 | 3,515 | 2,311 | 543 |
| 1996 | 1,643,731 | 4,540 | 3,308 | 2,839 | 2,504 | 1,974 | 550 |
| 1997 | 1,607,957 | 4,796 | 3,240 | 2,672 | 1,896 | 1,819 | 506 |
| 1998 | 1,712,268 | 5,369 | 3,459 | 2,378 | 1,846 | 1,603 | 486 |
| 1999 | 1,729,878 | 5,904 | 3,519 | 2,805 | 2,318 | 1,431 | 1,091 |
| 2000 | 1,778,352 | 6,648 | 3,674 | 3,176 | 2,806 | 1,332 | 775 |
| 2001 | 1,788,646 | 7,461 | 4,014 | 3,197 | 3,133 | 1,277 | 632 |
| 2002 | 1,882,584 | 8,209 | 4,493 | 2,795 | 3,854 | 1,199 | 633 |
Source: Treatment Episode Data Sets (2004)