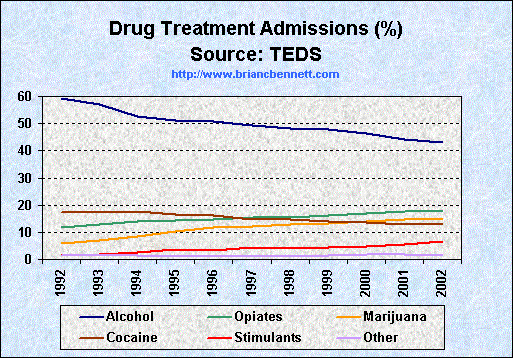
| Distribution of Drug Treatment Admissions - Major Drugs (% of total) | ||||||||
|---|---|---|---|---|---|---|---|---|
| Year | Total | Alcohol | Opiates | Marijuana | Cocaine | Stimulants | Other Drugs | None Reported |
| 1992 | 1,560,311 | 59.3 | 11.8 | 5.9 | 17.3 | 1.4 | 1.4 | 2.9 |
| 1993 | 1,618,597 | 56.9 | 13.0 | 6.9 | 17.4 | 1.8 | 1.3 | 2.7 |
| 1994 | 1,671,039 | 52.8 | 13.9 | 8.6 | 17.8 | 2.7 | 1.3 | 3.0 |
| 1995 | 1,680,697 | 51.1 | 14.5 | 10.2 | 16.6 | 3.8 | 1.3 | 2.6 |
| 1996 | 1,643,731 | 50.7 | 14.7 | 11.7 | 16.1 | 3.2 | 1.2 | 2.5 |
| 1997 | 1,607,957 | 49.5 | 15.6 | 12.3 | 14.7 | 4.2 | 1.2 | 2.4 |
| 1998 | 1,712,268 | 48.4 | 15.6 | 12.9 | 14.9 | 4.2 | 1.3 | 2.9 |
| 1999 | 1,729,878 | 47.8 | 16.2 | 13.4 | 14.1 | 4.3 | 1.6 | 2.7 |
| 2000 | 1,778,352 | 46.3 | 17.0 | 14.1 | 13.6 | 4.7 | 1.8 | 2.5 |
| 2001 | 1,788,646 | 44.3 | 17.7 | 14.8 | 12.9 | 5.6 | 1.9 | 2.7 |
| 2002 | 1,882,584 | 42.9 | 17.6 | 15.1 | 12.8 | 6.7 | 1.6 | 3.3 |
Source: Treatment Episode Data Sets (2004)