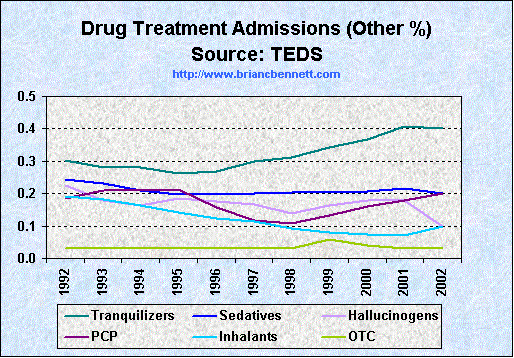
| Distribution of Drug Treatment Admissions - "Other" Drugs (% of total) | |||||||
|---|---|---|---|---|---|---|---|
| Year | Total | Tranquilizers | Sedatives | Hallucinogens | PCP | Inhalants | OTC |
| 1992 | 1,560,311 | 0.30 | 0.24 | 0.22 | 0.19 | 0.19 | 0.03 |
| 1993 | 1,618,597 | 0.28 | 0.23 | 0.18 | 0.21 | 0.18 | 0.03 |
| 1994 | 1,671,039 | 0.28 | 0.21 | 0.16 | 0.21 | 0.16 | 0.03 |
| 1995 | 1,680,697 | 0.26 | 0.20 | 0.18 | 0.21 | 0.14 | 0.03 |
| 1996 | 1,643,731 | 0.27 | 0.20 | 0.18 | 0.16 | 0.12 | 0.03 |
| 1997 | 1,607,957 | 0.30 | 0.20 | 0.17 | 0.12 | 0.11 | 0.03 |
| 1998 | 1,712,268 | 0.31 | 0.20 | 0.14 | 0.11 | 0.09 | 0.03 |
| 1999 | 1,729,878 | 0.34 | 0.20 | 0.16 | 0.13 | 0.08 | 0.06 |
| 2000 | 1,778,352 | 0.37 | 0.21 | 0.18 | 0.16 | 0.07 | 0.04 |
| 2001 | 1,788,646 | 0.41 | 0.21 | 0.18 | 0.18 | 0.07 | 0.03 |
| 2002 | 1,882,584 | 0.40 | 0.20 | 0.10 | 0.20 | 0.10 | 0.03 |
Source: Treatment Episode Data Sets (2004)