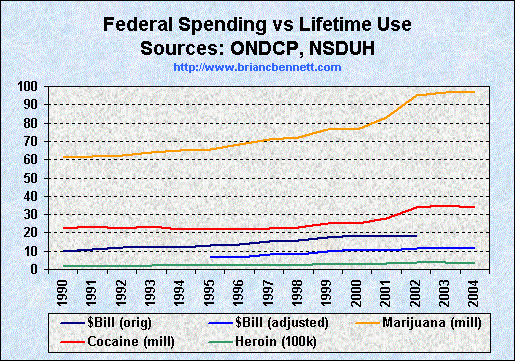
Federal Drug War Spending vs Lifetime Use Rates

Sources: ONDCP National Drug Control Strategy
National Survey on Drug Use and Health
| Total Federal Drug War Budget versus Lifetime Use of Marijuana Cocaine and Heroin | |||||
|---|---|---|---|---|---|
| Year | Original Budget (billions) | Adjusted Budget (billions) | Marijuana | Cocaine | Heroin |
| 1981 | 1.5 | -- | -- | -- | -- |
| 1982 | 1.7 | -- | 53,312,000 | 21,756,000 | 1,771,000 |
| 1983 | 2.0 | -- | -- | -- | -- |
| 1984 | 2.4 | -- | -- | -- | -- |
| 1985 | 2.8 | -- | 56,547,000 | 21,495,000 | 1,826,000 |
| 1986 | 2.9 | -- | -- | -- | -- |
| 1987 | 4.8 | -- | -- | -- | -- |
| 1988 | 4.7 | -- | 60,755,000 | 21,058,000 | 1,749,000 |
| 1989 | 6.7 | -- | -- | -- | -- |
| 1990 | 9.8 | -- | 61,266,000 | 22,617,000 | 1,517,000 |
| 1991 | 10.9 | -- | 61,900,000 | 23,271,000 | 2,433,000 |
| 1992 | 11.9 | -- | 62,075,000 | 22,482,000 | 1,687,000 |
| 1993 | 12.2 | -- | 64,149,000 | 23,369,000 | 2,102,000 |
| 1994 | 12.2 | -- | 65,229,000 | 21,821,000 | 2,083,000 |
| 1995 | 13.3 | 7.0 | 65,545,000 | 21,700,000 | 2,451,000 |
| 1996 | 13.4 | 6.8 | 68,571,000 | 22,130,000 | 2,444,000 |
| 1997 | 15.2 | 8.1 | 71,112,000 | 22,597,000 | 2,019,000 |
| 1998 | 15.8 | 8.2 | 72,070,000 | 23,089,000 | 2,371,000 |
| 1999 | 17.7 | 9.8 | 76,428,000 | 25,406,000 | 3,054,000 |
| 2000 | 18.5 | 10.7 | 76,321,000 | 24,896,000 | 2,779,000 |
| 2001 | 18.1 | 10.4 | 83,272,000 | 27,788,000 | 3,091,000 |
| 2002 | 18.8 | 11.5 | 94,946,000 | 33,910,000 | 3,668,000 |
| 2003 | -- | 11.4 | 96,611,000 | 34,891,000 | 3,744,000 |
| 2004 | -- | 11.9 | 96,772,000 | 34,153,000 | 3,145,000 |
| Note: The ONDCP changed their accounting practices in determining the levels of total federal drug war spending. The Drug Policy Alliance wrote a critique of the new calculation methods here. |
|
Latest complete use rates data: NSDUH (12 and older) or MTF (HS, College, Young Adult) |
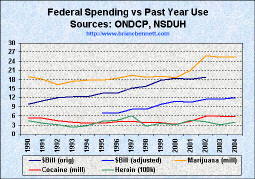
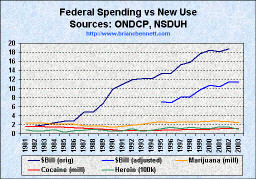
| Spending versus Past Year Use | Spending versus Past Month Use | Spending versus New Use |
 |
 |
 |
| truth: the Anti-drugwar | Anti-drugwar Arsenal | Accept the $1 Challenge |