Estimated Costs to Society of Drug Abuse,1992-2000 ($ Millions)
Year |
Health care costs |
Productivity losses |
Other costs |
Total |
1992 | 10,820 |
69,421 |
21,912 |
102,154 |
---|---|---|---|---|
1993 | 11,114 |
77,972 |
22,410 |
111,496 |
1994 |
11,279 | 82,685 |
24,440 |
118,404 |
1995 |
11,305 |
88,085 |
27,120 |
126,510 |
1996 |
11,428 |
92,423 |
27,444 |
131,295 |
1997 |
12,085 |
94,470 |
30,526 |
137,082 |
1998 |
12,862 |
98,467 |
32,083 |
143,411 |
19991 |
13,860 |
104,353 |
34,295 |
152,508 |
20001 |
14,899 |
110,491 |
35,274 |
160,664 |
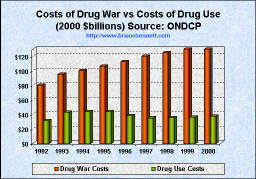
1Figures for 1999 and 2000 are projections based on observable trends for 1992 through 1998. Source: Office of National Drug Control Policy. The Economic Costs of Drug Abuse in the United States, 1992-2000 (September 2001).
Clearly, the bulk of costs are those related to lost productivity, with other costs a distant second, and health care costs trailing behind at half the cost of "other." To understand what this all means however, requires a full breakdown of the cost aggregations. Let's have a look shall we:
Health Care Costs include:
So why were these particular cost breakdowns chosen? If we really want to know what is going on, shouldn't we aggregate and compare the costs of drug use to the costs of drug war? Yes, we should look at the data that way. When we do, it shows us quite convincingly that we are spending three times as much money trying to stop drug use, than the actual drug use is supposedly costing us:
Click the graphic to get the whole story |
truth: the Anti-drugwar | Anti-drugwar Arsenal | Accept the $1 Challenge |