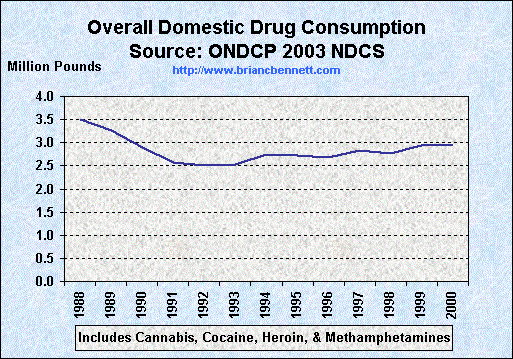
Trends in Drug Consumption

Source: Office of National Drug Control Policy,
2003 National Drug Control Strategy
| Estimated Drug Consumption (MT * 2204.6 = lbs) | ||||||||||
|---|---|---|---|---|---|---|---|---|---|---|
| Total | Marijuana | Cocaine | Methamphet | Heroin | ||||||
| Year | MT | Pounds | MT | Pounds | MT | Pounds | MT | Pounds | MT | Pounds |
| 1988 | 1,592 | 3,509,723 | 894 | 1,970,912 | 660 | 1,455,036 | 23 | 50,706 | 15 | 33,069 |
| 1989 | 1,478 | 3,258,399 | 866 | 1,909,184 | 576 | 1,269,850 | 19 | 41,887 | 17 | 37,478 |
| 1990 | 1,314 | 2,896,844 | 837 | 1,845,250 | 447 | 985,456 | 16 | 35,274 | 14 | 30,864 |
| 1991 | 1,170 | 2,579,382 | 793 | 1,748,248 | 355 | 782,633 | 10 | 22,046 | 12 | 26,455 |
| 1992 | 1,133 | 2,497,812 | 761 | 1,677,701 | 346 | 762,792 | 14 | 30,864 | 12 | 26,455 |
| 1993 | 1,152 | 2,539,699 | 791 | 1,743,839 | 331 | 729,723 | 19 | 41,887 | 11 | 24,251 |
| 1994 | 1,242 | 2,738,113 | 874 | 1,926,820 | 323 | 712,086 | 34 | 74,956 | 11 | 24,251 |
| 1995 | 1,235 | 2,722,681 | 848 | 1,869,501 | 321 | 707,677 | 54 | 119,048 | 12 | 26,455 |
| 1996 | 1,215 | 2,678,589 | 847 | 1,867,296 | 301 | 663,585 | 54 | 119,048 | 13 | 28,660 |
| 1997 | 1,282 | 2,826,297 | 960 | 2,116,416 | 275 | 606,265 | 35 | 77,161 | 12 | 26,455 |
| 1998 | 1,260 | 2,777,796 | 952 | 2,098,779 | 267 | 588,628 | 27 | 59,524 | 14 | 30,864 |
| 1999 | 1,331 | 2,934,323 | 1,028 | 2,266,329 | 271 | 597,447 | 18 | 39,683 | 14 | 30,864 |
| 2000 | 1,339 | 2,951,959 | 1,047 | 2,308,216 | 259 | 570,991 | 20 | 44,092 | 13 | 28,660 |