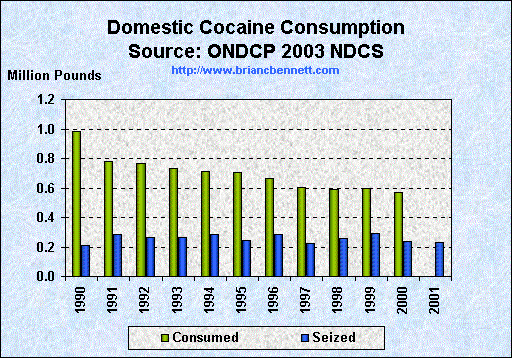
| Estimated Cocaine Consumption vs Federal Seizures | ||||
|---|---|---|---|---|
| Consumption (MT * 2204.6 = lbs) | Seizures (Kg * 2.2 = lbs) | |||
| Year | Metric Tons | Pounds | Kilograms | Pounds |
| 1988 | 660 | 1,455,036 | -- | -- |
| 1989 | 576 | 1,269,850 | 114,903 | 252,787 |
| 1990 | 447 | 985,456 | 96,085 | 211,387 |
| 1991 | 355 | 782,633 | 128,247 | 282,143 |
| 1992 | 346 | 762,792 | 120,175 | 264,385 |
| 1993 | 331 | 729,723 | 121,215 | 266,673 |
| 1994 | 323 | 712,086 | 129,378 | 284,632 |
| 1995 | 321 | 707,677 | 111,031 | 244,268 |
| 1996 | 301 | 663,585 | 128,555 | 282,821 |
| 1997 | 275 | 606,265 | 101,495 | 223,289 |
| 1998 | 267 | 588,628 | 118,436 | 260,559 |
| 1999 | 271 | 597,447 | 132,063 | 290,539 |
| 2000 | 259 | 570,991 | 106,619 | 234,562 |
| 2001 | -- | -- | 105,885 | 232,947 |
Source: Office of National Drug Control Policy,
2003 National Drug Control Strategy