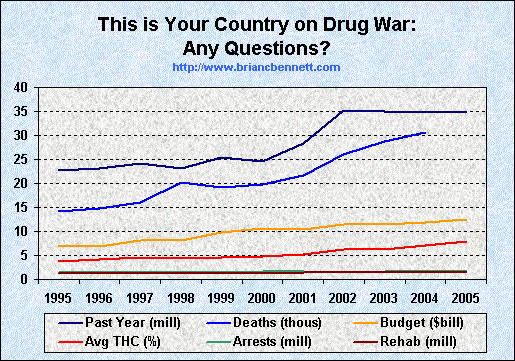
Drugwar Battle Damage Assessment 1995 - 2005

And this is after over 100 years of trying!
| truth: the Anti-drugwar | Anti-drugwar Arsenal | Accept the $1 Challenge |

And this is after over 100 years of trying!
| The War on Drugs in Perspective 1995 - 2005 | ||||||
|---|---|---|---|---|---|---|
| Year | Budget (billions) | Past Year Users | Drug-Induced Deaths | Avg THC | Drug Law Arrests | Rehab Admissions |
| 1995 | 7.0 | 22,662,000 | 14,218 | 3.8 | 1,476,100 | 1,186,485 |
| 1996 | 6.8 | 23,182,000 | 14,843 | 4.1 | 1,506,200 | 1,170,195 |
| 1997 | 8.1 | 24,189,000 | 15,973 | 4.5 | 1,583,600 | 1,162,258 |
| 1998 | 8.2 | 23,115,000 | 20,227 | 4.4 | 1,559,100 | 1,249,576 |
| 1999 | 9.8 | 25,402,000 | 19,102 | 4.6 | 1,557,100 | 1,264,353 |
| 2000 | 10.7 | 24,535,000 | 19,698 | 4.9 | 1,579,566 | 1,311,355 |
| 2001 | 10.4 | 28,409,000 | 21,683 | 5.3 | 1,586,902 | 1,378,580 |
| 2002 | 11.5 | 35,132,000 | 26,018 | 6.4 | 1,538,813 | 1,479,435 |
| 2003 | 11.4 | 34,993,000 | 28,783 | 6.3 | 1,678,192 | 1,459,492 |
| 2004 | 11.9 | 34,807,000 | 30,711 | 7.1 | 1,745,712 | 1,468,047 |
| 2005 | 12.6 | 35,041,000 | -- | 8.0 | 1,846,351 | 1,450,892 |
| % Change | Up 79% | Up 55% | Up 116% | Up 113% | Up 25% | Up 22% |
| Sources: |
|
|
Past Year use is "any illicit" drug use. Notice that since 2002, the number of users is higher than it was at the alleged "peak of drug use" in 1979 (31,485,000). Tell everyone. Mortality data includes deaths that are characterized as "drug-induced" that are not necessarily caused by illicit drug use. Average THC content is expressed as the average across all product types. Rehab Admissions excludes those involving alcohol only. Related Material |
| truth: the Anti-drugwar | Anti-drugwar Arsenal | Accept the $1 Challenge |