|

|
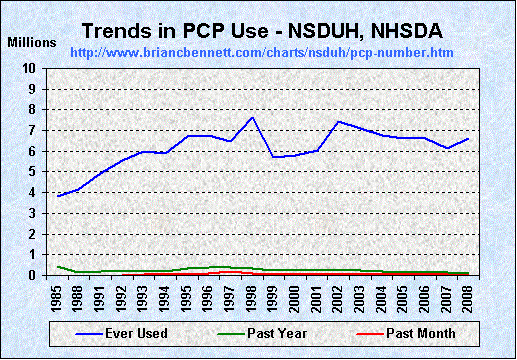
| Trends in PCP Use Among Those 12 and Older -- by Number of Users (1985 - 2008) | |||
|---|---|---|---|
| Year | Ever Used | Past Year | Past Month |
| 1985 | 3,811,000 | 455,000 | -- |
| 1988 | 4,143,000 | 167,000 | -- |
| 1991 | 4,936,000 | 172,000 | -- |
| 1992 | 5,550,000 | 207,000 | 16,000 |
| 1993 | 5,983,000 | 199,000 | 29,000 |
| 1994 | 5,911,000 | 206,000 | 34,000 |
| 1995 | 6,718,000 | 322,000 | 40,000 |
| 1996 | 6,755,000 | 382,000 | 120,000 |
| 1997 | 6,480,000 | 369,000 | 190,000 |
| 1998 | 7,640,000 | 346,000 | 91,000 |
| 1999 | 5,693,000 | 245,000 | 55,000 |
| 2000 | 5,804,000 | 264,000 | 54,000 |
| 2001 | 6,025,000 | 250,000 | 54,000 |
| 2002 | 7,418,000 | 235,000 | 58,000 |
| 2003 | 7,107,000 | 219,000 | 56,000 |
| 2004 | 6,762,000 | 210,000 | 49,000 |
| 2005 | 6,603,000 | 164,000 | 48,000 |
| 2006 | 6,618,000 | 187,000 | 30,000 |
| 2007 | 6,140,000 | 137,000 | 41,000 |
| 2008 | 6,631,000 | 99,000 | 24,000 |
| truth: the Anti-drugwar | ||
| Homepage | Sitemap | |