|

|
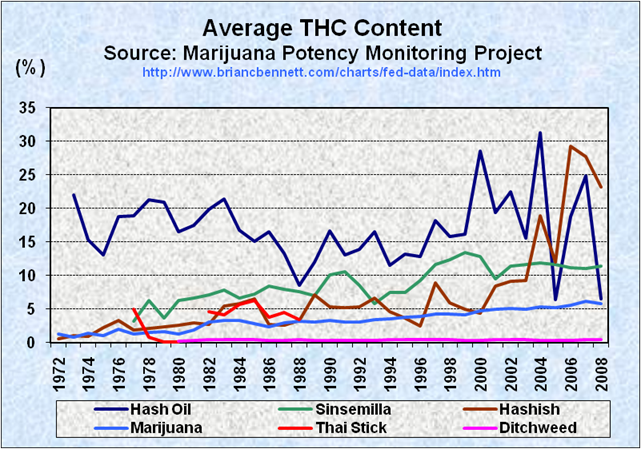
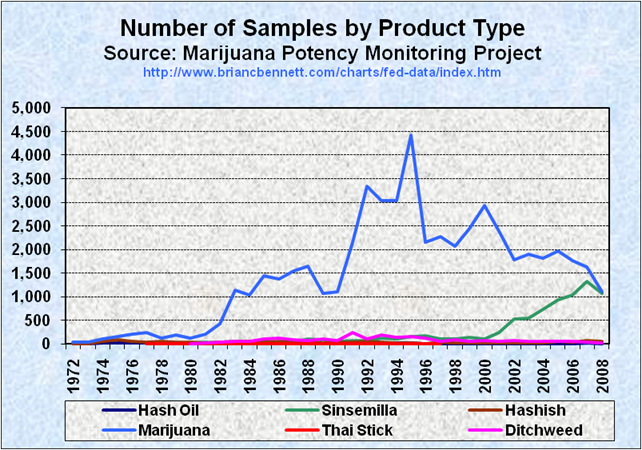
| Average THC Content in Seized Cannabis Samples (1972 - 2008) | ||||||||||||
|---|---|---|---|---|---|---|---|---|---|---|---|---|
| Hash Oil | Sinsemilla | Hashish | Marijuana | Thai Stick | Ditchweed | |||||||
| Year | Number | Avg THC % | Number | Avg THC % | Number | Avg THC % | Number | Avg THC % | Number | Avg THC % | Number | Avg THC % |
| 1972 | -- | -- | -- | -- | 6 | 0.60 | 34 | 1.23 | -- | -- | -- | -- |
| 1973 | 6 | 22.00 | -- | -- | 11 | 1.00 | 33 | 0.83 | -- | -- | -- | -- |
| 1974 | 18 | 15.34 | -- | -- | 53 | 0.86 | 113 | 1.34 | 1 | 0.54 | -- | -- |
| 1975 | 29 | 13.09 | -- | -- | 86 | 2.28 | 149 | 1.05 | -- | -- | -- | -- |
| 1976 | 18 | 18.82 | -- | -- | 52 | 3.28 | 209 | 1.94 | -- | -- | -- | -- |
| 1977 | 17 | 18.89 | 15 | 3.20 | 44 | 1.81 | 235 | 1.27 | 1 | 4.91 | -- | -- |
| 1978 | 9 | 21.31 | 1 | 6.28 | 51 | 2.15 | 128 | 1.47 | 1 | 0.82 | -- | -- |
| 1979 | 9 | 20.91 | 10 | 3.66 | 43 | 2.32 | 191 | 1.58 | 1 | 0.13 | -- | -- |
| 1980 | 8 | 16.56 | 26 | 6.33 | 37 | 2.58 | 120 | 1.24 | 1 | 0.05 | 6 | 0.26 |
| 1981 | 5 | 17.45 | 31 | 6.58 | 13 | 2.91 | 209 | 1.83 | -- | -- | 20 | 0.32 |
| 1982 | 8 | 19.88 | 14 | 7.10 | 32 | 2.69 | 435 | 3.07 | 8 | 4.60 | 30 | 0.44 |
| 1983 | 30 | 21.36 | 17 | 7.87 | 47 | 5.47 | 1145 | 3.30 | 7 | 4.17 | 60 | 0.45 |
| 1984 | 33 | 16.75 | 36 | 6.67 | 59 | 5.75 | 1030 | 3.31 | 3 | 5.71 | 50 | 0.42 |
| 1985 | 25 | 15.08 | 52 | 7.28 | 41 | 6.49 | 1448 | 2.83 | 1 | 6.26 | 102 | 0.48 |
| 1986 | 23 | 16.51 | 32 | 8.43 | 53 | 2.66 | 1372 | 2.37 | 6 | 3.73 | 124 | 0.31 |
| 1987 | 22 | 13.36 | 43 | 7.93 | 63 | 2.62 | 1551 | 2.96 | 3 | 4.45 | 86 | 0.34 |
| 1988 | 16 | 8.52 | 98 | 7.62 | 43 | 3.35 | 1640 | 3.18 | 2 | 3.37 | 69 | 0.39 |
| 1989 | 9 | 11.96 | 86 | 6.95 | 19 | 7.06 | 1075 | 3.04 | -- | -- | 104 | 0.29 |
| 1990 | 12 | 16.60 | 61 | 10.10 | 38 | 5.30 | 1108 | 3.24 | 1 | 0.12 | 78 | 0.33 |
| 1991 | 10 | 13.07 | 75 | 10.53 | 31 | 5.21 | 2149 | 3.09 | -- | -- | 246 | 0.31 |
| 1992 | 22 | 13.85 | 76 | 8.57 | 61 | 5.35 | 3336 | 3.08 | -- | -- | 107 | 0.31 |
| 1993 | 17 | 16.52 | 123 | 5.77 | 39 | 6.60 | 3033 | 3.38 | -- | -- | 189 | 0.37 |
| 1994 | 14 | 11.57 | 104 | 7.49 | 29 | 4.60 | 3032 | 3.50 | -- | -- | 136 | 0.38 |
| 1995 | 13 | 13.23 | 164 | 7.51 | 19 | 3.60 | 4430 | 3.73 | 2 | 4.52 | 149 | 0.41 |
| 1996 | 8 | 12.82 | 168 | 9.23 | 12 | 2.52 | 2148 | 3.87 | -- | -- | 115 | 0.38 |
| 1997 | 10 | 18.20 | 111 | 11.62 | 31 | 8.92 | 2273 | 4.25 | -- | -- | 57 | 0.49 |
| 1998 | 5 | 15.78 | 101 | 12.33 | 15 | 5.87 | 2075 | 4.22 | -- | -- | 81 | 0.39 |
| 1999 | 11 | 16.21 | 136 | 13.38 | 23 | 4.94 | 2450 | 4.18 | -- | -- | 59 | 0.37 |
| 2000 | 7 | 28.58 | 113 | 12.80 | 27 | 4.37 | 2928 | 4.67 | 1 | 3.27 | 69 | 0.35 |
| 2001 | 7 | 19.44 | 235 | 9.55 | 13 | 8.48 | 2398 | 5.02 | -- | -- | 59 | 0.43 |
| 2002 | 5 | 22.51 | 528 | 11.36 | 16 | 9.12 | 1789 | 5.11 | -- | -- | 67 | 0.40 |
| 2003 | 4 | 15.54 | 538 | 11.59 | 16 | 9.23 | 1893 | 4.97 | -- | -- | 57 | 0.38 |
| 2004 | 4 | 31.32 | 731 | 11.91 | 25 | 18.95 | 1815 | 5.38 | -- | -- | 53 | 0.34 |
| 2005 | 6 | 6.40 | 932 | 11.63 | 47 | 11.98 | 1964 | 5.25 | -- | -- | 52 | 0.37 |
| 2006 | 3 | 18.74 | 1032 | 11.20 | 32 | 29.33 | 1770 | 5.58 | -- | -- | 49 | 0.30 |
| 2007 | 18 | 24.85 | 1327 | 11.08 | 70 | 27.71 | 1635 | 6.11 | -- | -- | 40 | 0.39 |
| 2008 | 12 | 6.54 | 1068 | 11.46 | 50 | 23.14 | 1102 | 5.81 | -- | -- | 26 | 0.43 |
Sources: University of Mississippi, Marijuana Potency Monitoring Project*