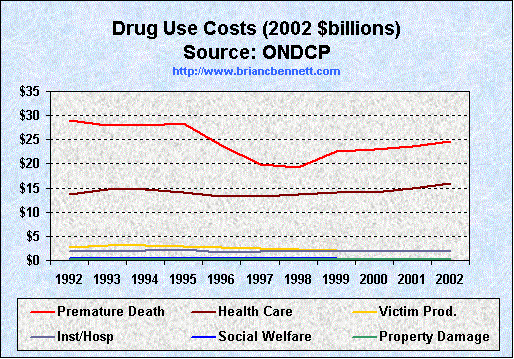
Categorizations and Values for Drug Use Costs (2002 $billions) | |||||||||||
---|---|---|---|---|---|---|---|---|---|---|---|
Category | 1992 | 1993 | 1994 | 1995 | 1996 | 1997 | 1998 | 1999 | 2000 | 2001 | 2002 |
Premature Death | $28.961 | $27.877 | $28.034 | $28.406 | $23.745 | $19.901 | $19.323 | $22.535 | $23.045 | $23.686 | $24.646 |
Health Care Costs | $13.659 | $14.662 | $14.673 | $13.996 | $13.158 | $13.236 | $13.756 | $14.044 | $14.128 | $14.861 | $15.845 |
Productivity Loss of Victims of Crime |
$2.640 | $3.098 | $3.100 | $2.806 | $2.674 | $2.570 | $2.279 | $2.111 | $1.930 | $1.835 | $1.800 |
Institutionalization/ Hospitalization |
$1.894 | $1.870 | $2.043 | $2.210 | $1.758 | $1.863 | $1.971 | $1.873 | $1.782 | $1.870 | $1.996 |
Social Welfare | $0.337 | $0.418 | $0.432 | $0.442 | $0.446 | $0.434 | $0.417 | $0.317 | $0.275 | $0.253 | $0.235 |
Property Damage | $0.247 | $0.285 | $0.280 | $0.256 | $0.245 | $0.233 | $0.205 | $0.206 | $0.206 | $0.206 | $0.206 |
Grand Totals | $47.74 | $48.21 | $48.56 | $48.12 | $42.03 | $38.24 | $37.95 | $41.09 | $41.37 | $42.71 | $44.73 |
Source: The Economic Costs of Drug Abuse in the United States,
Office of National Drug Control Policy (Dec 2004)
Table Notes:
Health Care Costs are mostly from Community Based Specialty Treatment (approx 38% of total health care costs) and HIV/AIDS treatment (approx 24% of total health care costs) for a combined 62% of the total Health Care Costs. |
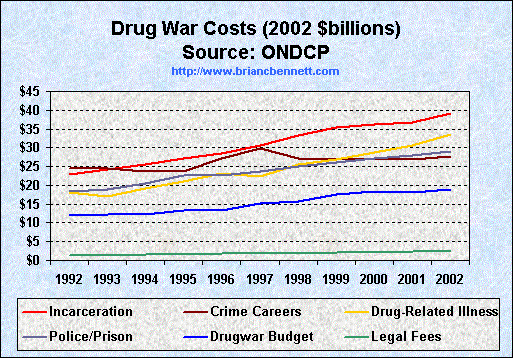
Categorizations and Values for Drug War Costs (2002 $billions) | |||||||||||
---|---|---|---|---|---|---|---|---|---|---|---|
Category | 1992 | 1993 | 1994 | 1995 | 1996 | 1997 | 1998 | 1999 | 2000 | 2001 | 2002 |
Lost Wages Due to Incarceration | $22.961 | $24.110 | $25.607 | $27.130 | $28.473 | $30.511 | $33.257 | $35.399 | $36.244 | $36.869 | $39.095 |
Crime Careers | $24.617 | $24.595 | $23.796 | $23.812 | $27.241 | $29.824 | $27.180 | $26.952 | $26.836 | $26.957 | $27.576 |
Drug Abuse Related Illness | $18.214 | $17.138 | $19.234 | $20.938 | $23.241 | $22.323 | $25.542 | $26.995 | $28.654 | $30.681 | $33.452 |
Police/Prison | $18.470 | $18.857 | $20.371 | $22.508 | $22.763 | $23.590 | $24.922 | $26.146 | $27.036 | $28.067 | $29.051 |
Federal Drug War Budget | $11.90 | $12.20 | $12.20 | $13.30 | $13.40 | $15.20 | $15.80 | $17.70 | $18.50 | $18.10 | $18.80 |
Private Legal Defense | $0.468 | $0.483 | $0.521 | $0.528 | $0.510 | $0.585 | $0.605 | $0.555 | $0.596 | $0.643 | $0.647 |
Grand Totals | $96.63 | $97.38 | $101.73 | $108.22 | $115.63 | $122.03 | $127.31 | $133.75 | $137.87 | $141.32 | $148.62 |
Source: The Economic Costs of Drug Abuse in the United States,
Office of National Drug Control Policy (Dec 2004)
Notes: Police/Prison costs in the graph are the aggregated costs of Police Services, Legal System Costs, State & Federal Corrections, and Local Corrections. See the source document for a complete breakdown of those individual costs.
Federal drug budget figures are taken from the 2003 ONDCP National Drug Control Strategy -- before they started 're-calculating' the budget costs. |
truth: the Anti-drugwar | Anti-drugwar Arsenal | Accept the $1 Challenge |