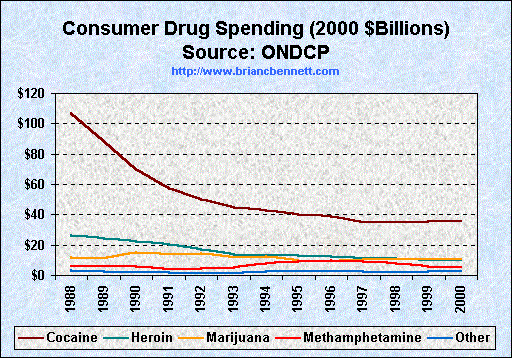
Consumer Drug Spending 1988-2000

| User Spending (2000 $Billions) | ||||||
|---|---|---|---|---|---|---|
| Year | Total | Cocaine | Heroin | Marijuana | Methamphetamine | Other |
| 1988 | $154 | 107.0 | 26.1 | 12.1 | 5.8 | 3.3 |
| 1989 | $132 | 88.4 | 24.3 | 11.0 | 5.8 | 2.8 |
| 1990 | $115 | 69.9 | 22.5 | 15.0 | 5.7 | 2.2 |
| 1991 | $97 | 57.1 | 20.3 | 14.0 | 3.7 | 2.3 |
| 1992 | $88 | 49.9 | 17.2 | 14.6 | 4.8 | 1.5 |
| 1993 | $77 | 45.0 | 13.8 | 12.0 | 5.1 | 1.5 |
| 1994 | $78 | 42.8 | 13.2 | 12.2 | 7.6 | 2.6 |
| 1995 | $75 | 40.0 | 13.2 | 10.2 | 9.2 | 2.7 |
| 1996 | $74 | 39.2 | 12.8 | 9.5 | 10.1 | 2.7 |
| 1997 | $68 | 34.7 | 11.4 | 10.5 | 9.3 | 2.5 |
| 1998 | $67 | 34.9 | 11.1 | 10.8 | 8.0 | 2.3 |
| 1999 | $65 | 35.6 | 10.1 | 10.6 | 5.8 | 2.6 |
| 2000 | $64 | 35.3 | 10.0 | 10.5 | 5.4 | 2.4 |
Source: ONDCP What America’s Users Spend on Illegal Drugs: 1988-2000