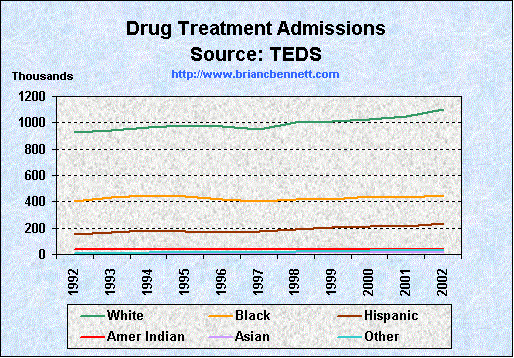
| Distribution of Drug Treatment Admissions by Ethnicity | |||||||
|---|---|---|---|---|---|---|---|
| Year | Total | White | Black | Hispanic | Amer. Indian | Asian | Other |
| 1992 | 1,560,311 | 923,856 | 401,478 | 152,488 | 38,531 | 7,738 | 9,557 |
| 1993 | 1,618,597 | 939,805 | 431,065 | 168,521 | 39,402 | 9,010 | 11,031 |
| 1994 | 1,671,039 | 963,257 | 447,945 | 181,168 | 38,404 | 9,873 | 12,896 |
| 1995 | 1,680,697 | 981,359 | 443,964 | 178,269 | 37,704 | 9,870 | 13,193 |
| 1996 | 1,643,731 | 973,808 | 418,514 | 169,285 | 40,082 | 10,197 | 16,606 |
| 1997 | 1,607,957 | 948,992 | 402,619 | 173,347 | 38,333 | 10,893 | 18,263 |
| 1998 | 1,712,268 | 1,004,115 | 419,784 | 191,484 | 40,511 | 11,515 | 20,351 |
| 1999 | 1,729,878 | 1,011,066 | 415,289 | 202,865 | 40,137 | 13,619 | 24,161 |
| 2000 | 1,778,352 | 1,028,144 | 437,320 | 211,483 | 40,407 | 14,859 | 28,588 |
| 2001 | 1,788,646 | 1,048,230 | 429,409 | 212,424 | 39,373 | 14,298 | 26,936 |
| 2002 | 1,882,584 | 1,097,962 | 446,946 | 236,652 | 39,463 | 16,552 | 27,620 |
Source: Treatment Episode Data Sets (2004)