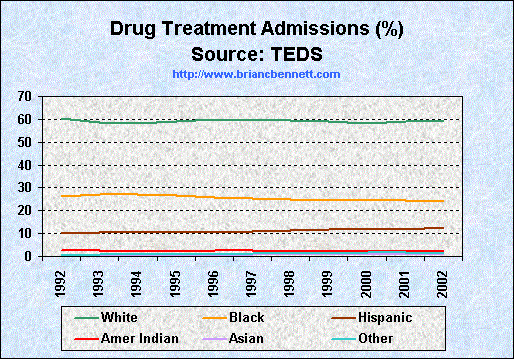
| Distribution of Drug Treatment Admissions by Ethnicity (%) | |||||||
|---|---|---|---|---|---|---|---|
| Year | Total | White | Black | Hispanic | Amer. Indian | Asian | Other |
| 1992 | 1,560,311 | 60.2 | 26.2 | 9.9 | 2.5 | 0.5 | 0.6 |
| 1993 | 1,618,597 | 58.8 | 27.0 | 10.5 | 2.5 | 0.6 | 0.7 |
| 1994 | 1,671,039 | 58.3 | 27.1 | 11.0 | 2.3 | 0.6 | 0.8 |
| 1995 | 1,680,697 | 59.0 | 26.7 | 10.7 | 2.3 | 0.6 | 0.8 |
| 1996 | 1,643,731 | 59.8 | 25.7 | 10.4 | 2.5 | 0.6 | 1.0 |
| 1997 | 1,607,957 | 59.6 | 25.3 | 10.9 | 2.4 | 0.7 | 1.1 |
| 1998 | 1,712,268 | 59.5 | 24.9 | 11.3 | 2.4 | 0.7 | 1.2 |
| 1999 | 1,729,878 | 59.2 | 24.3 | 11.9 | 2.4 | 0.8 | 1.4 |
| 2000 | 1,778,352 | 58.4 | 24.8 | 12.0 | 2.3 | 0.8 | 1.6 |
| 2001 | 1,788,646 | 59.2 | 24.3 | 12.0 | 2.2 | 0.8 | 1.5 |
| 2002 | 1,882,584 | 58.9 | 24.0 | 12.7 | 2.1 | 0.9 | 1.5 |
Source: Treatment Episode Data Sets (2004)