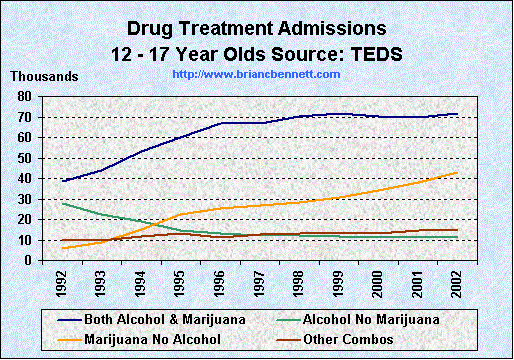
| Distribution of Drug Treatment Admissions by Alcohol & Marijuana Use Among 12 to 17 Year Olds | |||||||||||
|---|---|---|---|---|---|---|---|---|---|---|---|
| Drug(s) Used | 1992 | 1993 | 1994 | 1995 | 1996 | 1997 | 1998 | 1999 | 2000 | 2001 | 2002 |
| Both Alcohol & Marijuana | 38,378 | 43,815 | 53,362 | 60,233 | 66,917 | 67,068 | 70,102 | 71,558 | 70,134 | 69,877 | 71,489 |
| Primary Alcohol, No Marijuana | 27,960 | 22,408 | 18,896 | 14,856 | 13,377 | 12,255 | 11,972 | 11,775 | 11,284 | 11,356 | 11,156 |
| Primary Marijuana, No Alcohol | 5,852 | 8,762 | 15,028 | 22,644 | 28,544 | 26,694 | 28,174 | 30,491 | 33,976 | 37,952 | 42,862 |
| Other Drugs & Combinations | 10,297 | 9,774 | 11,887 | 13,394 | 11,096 | 12,737 | 13,234 | 13,157 | 13,287 | 14,517 | 14,629 |
| None Reported | 8,217 | 7,026 | 6,913 | 7,342 | 7,770 | 7,164 | 5,561 | 5,183 | 5,262 | 6,653 | 10,040 |
Source: Treatment Episode Data Sets (2004)