| Trends in Initiation of Non-Therapeutic Stimulants Use (1965 - 2003) | |
|---|---|
 |
 |
 |
 |
Source: National Survey on Drug Use and Health
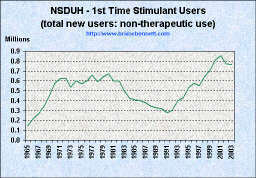
| Trends in Initiation of Non-Therapeutic Stimulants Use (1965 - 2003) | |
|---|---|
|
|
|
|
|
|
Source: National Survey on Drug Use and Health
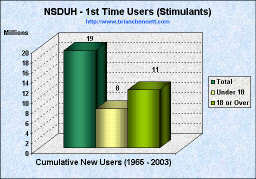
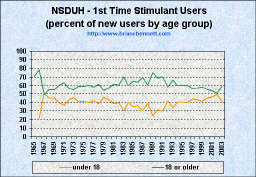
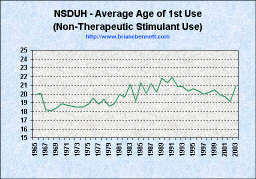
| YEAR | NUMBER OF INITIATES (1,000s) | MEAN AGE | AGE-SPECIFIC RATES1 | |||
|---|---|---|---|---|---|---|
| All Ages | Under 18 | 18 or Older | 12-17 | 18-25 | ||
| 1965 | 149 | * | 105 | 19.9 | * | 3.7 |
| 1966 | 218 | 47 | 171 | 20.1 | 2.2 | 7.5 |
| 1967 | 266 | 135 | 130 | 18.2 | 6.2 | 5.2 |
| 1968 | 348 | 156 | 192 | 18.1 | 7.1 | 8.1 |
| 1969 | 443 | 200 | 242 | 18.4 | 8.9 | 9.6 |
| 1970 | 577 | 228 | 349 | 18.9 | 10.0 | 13.2 |
| 1971 | 624 | 227 | 397 | 18.7 | 9.7 | 14.4 |
| 1972 | 626 | 270 | 356 | 18.6 | 11.4 | 12.7 |
| 1973 | 535 | 244 | 291 | 18.5 | 10.4 | 9.6 |
| 1974 | 603 | 247 | 356 | 18.5 | 10.4 | 12.8 |
| 1975 | 573 | 237 | 337 | 18.8 | 9.7 | 11.3 |
| 1976 | 600 | 237 | 363 | 19.5 | 10.1 | 11.7 |
| 1977 | 656 | 276 | 380 | 18.8 | 11.8 | 11.9 |
| 1978 | 593 | 227 | 366 | 19.4 | 9.9 | 11.0 |
| 1979 | 643 | 295 | 348 | 18.6 | 13.4 | 10.7 |
| 1980 | 672 | 291 | 381 | 18.9 | 13.5 | 11.9 |
| 1981 | 595 | 229 | 367 | 20.0 | 10.9 | 9.2 |
| 1982 | 597 | 236 | 361 | 19.6 | 11.0 | 10.0 |
| 1983 | 488 | 148 | 340 | 21.1 | 7.2 | 8.2 |
| 1984 | 424 | 169 | 255 | 19.2 | 8.2 | 7.4 |
| 1985 | 409 | 142 | 266 | 21.3 | 7.1 | 6.5 |
| 1986 | 397 | 142 | 255 | 20.1 | 7.2 | 7.3 |
| 1987 | 377 | 114 | 263 | 21.2 | 5.7 | 6.9 |
| 1988 | 344 | 135 | 209 | 20.2 | 7.1 | 5.7 |
| 1989 | 328 | 81 | 246 | 21.8 | 4.0 | 6.7 |
| 1990 | 317 | 99 | 218 | 21.3 | 5.0 | 6.0 |
| 1991 | 278 | 83 | 196 | 21.9 | 4.0 | 4.7 |
| 1992 | 303 | 127 | 176 | 20.8 | 6.2 | 4.3 |
| 1993 | 399 | 134 | 265 | 20.8 | 6.6 | 7.1 |
| 1994 | 432 | 174 | 258 | 20.3 | 8.1 | 6.8 |
| 1995 | 533 | 215 | 318 | 20.6 | 9.8 | 9.0 |
| 1996 | 577 | 228 | 349 | 20.3 | 10.2 | 10.2 |
| 1997 | 553 | 245 | 308 | 20.0 | 10.6 | 8.9 |
| 1998 | 648 | 280 | 369 | 20.2 | 11.7 | 10.1 |
| 1999 | 706 | 293 | 412 | 20.5 | 11.9 | 10.6 |
| 2000 | 808 | 362 | 446 | 19.9 | 14.6 | 12.0 |
| 2001 | 853 | 396 | 457 | 19.7 | 16.1 | 12.5 |
| 20022 | 775 | 381 | 393 | 19.1 | 15.0 | 11.0 |
| 20033 | 764 | 308 | 457 | 20.9 | 11.9 | 10.8 |
| *Low precision; no estimate reported. -- Not available. NOTE: Comparisons between years, particularly between recent estimates and those from 10 or more years prior, should be made with caution due to potential bias from reporting and other sources. 1 The numerator of each rate is the number of persons in the age group who initiated use of the drug in the specified year, while the denominator is the person-time exposure of persons in the age group measured in thousands of years. 2 Estimated using 2003 and 2004 data only. 3 Estimated using 2004 data only. Source: SAMHSA, Office of Applied Studies, National Survey on Drug Use and Health, 2002, 2003, and 2004. |
||||||
| truth: the Anti-drugwar | Anti-drugwar Arsenal | Accept the $1 Challenge |