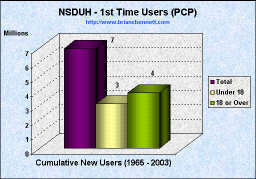
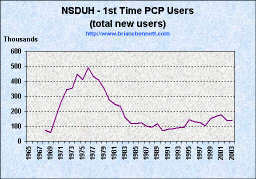
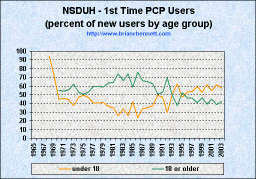
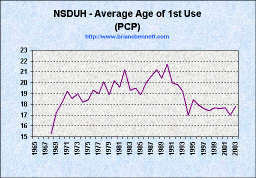
| Trends in Initiation of PCP Use (1965 - 2003) | |
|---|---|
 |
 |
 |
 |
Source: National Survey on Drug Use and Health
| Trends in Initiation of PCP Use (1965 - 2003) | |
|---|---|
 |
 |
 |
 |
Source: National Survey on Drug Use and Health
| YEAR | NUMBER OF INITIATES (1,000s) | MEAN AGE | AGE-SPECIFIC RATES1 | |||
|---|---|---|---|---|---|---|
| All Ages | Under 18 | 18 or Older | 12-17 | 18-25 | ||
| 1965 | * | * | * | * | * | * |
| 1966 | * | * | * | * | * | * |
| 1967 | * | * | * | * | * | * |
| 1968 | 72 | 68 | * | 15.3 | 3.1 | * |
| 1969 | 58 | 43 | * | 17.2 | 1.8 | * |
| 1970 | 171 | 77 | 94 | 18.1 | 3.4 | 3.5 |
| 1971 | 264 | 121 | 143 | 19.2 | 5.2 | 4.6 |
| 1972 | 343 | 152 | 191 | 18.5 | 6.5 | 6.3 |
| 1973 | 352 | 132 | 219 | 19.0 | 5.6 | 7.7 |
| 1974 | 447 | 211 | 236 | 18.2 | 8.7 | 7.9 |
| 1975 | 409 | 203 | 206 | 18.4 | 8.5 | 6.4 |
| 1976 | 489 | 229 | 260 | 19.3 | 9.7 | 7.6 |
| 1977 | 433 | 177 | 257 | 19.0 | 7.6 | 7.9 |
| 1978 | 407 | 164 | 243 | 20.1 | 7.2 | 6.2 |
| 1979 | 350 | 144 | 206 | 18.9 | 6.5 | 6.1 |
| 1980 | 278 | 102 | 176 | 20.2 | 4.6 | 4.9 |
| 1981 | 247 | 87 | 159 | 19.6 | 4.1 | 4.5 |
| 1982 | 234 | 60 | 173 | 21.2 | 2.8 | 4.4 |
| 1983 | 157 | 53 | 104 | 19.3 | 2.6 | 3.2 |
| 1984 | 121 | 31 | 90 | 19.5 | 1.5 | 2.8 |
| 1985 | 116 | 49 | 68 | 18.9 | 2.4 | 2.1 |
| 1986 | 124 | 29 | 94 | 20.0 | 1.4 | 2.7 |
| 1987 | 101 | 34 | 67 | 20.6 | 1.7 | 1.7 |
| 1988 | 94 | 33 | 61 | 21.2 | 1.7 | 1.3 |
| 1989 | 117 | 44 | 73 | 20.4 | 2.3 | 1.8 |
| 1990 | 71 | 35 | 36 | 21.7 | 1.8 | 0.6 |
| 1991 | 81 | 38 | 43 | 20.0 | 1.9 | 1.1 |
| 1992 | 85 | 25 | 59 | 19.8 | 1.3 | 1.8 |
| 1993 | 89 | 45 | 44 | 19.2 | 2.2 | 1.3 |
| 1994 | 94 | 59 | 35 | 17.0 | 2.9 | 1.3 |
| 1995 | 145 | 68 | 76 | 18.4 | 3.2 | 2.7 |
| 1996 | 131 | 69 | 61 | 17.9 | 3.1 | 1.9 |
| 1997 | 124 | 67 | 57 | 17.6 | 2.8 | 2.0 |
| 1998 | 105 | 62 | 43 | 17.4 | 2.6 | 1.4 |
| 1999 | 149 | 79 | 69 | 17.7 | 3.3 | 2.5 |
| 2000 | 166 | 102 | 65 | 17.6 | 4.1 | 2.0 |
| 2001 | 177 | 97 | 79 | 17.7 | 3.9 | 2.4 |
| 20022 | 141 | 87 | 54 | 17.0 | 3.4 | 1.8 |
| 20033 | 136 | 78 | 58 | 17.8 | 3.0 | 1.4 |
| *Low precision; no estimate reported. -- Not available. NOTE: Comparisons between years, particularly between recent estimates and those from 10 or more years prior, should be made with caution due to potential bias from reporting and other sources. 1 The numerator of each rate is the number of persons in the age group who initiated use of the drug in the specified year, while the denominator is the person-time exposure of persons in the age group measured in thousands of years. 2 Estimated using 2003 and 2004 data only. 3 Estimated using 2004 data only. Source: SAMHSA, Office of Applied Studies, National Survey on Drug Use and Health, 2002, 2003, and 2004. |
||||||
| truth: the Anti-drugwar | Anti-drugwar Arsenal | Accept the $1 Challenge |