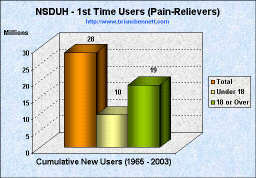
| Trends in Initiation of Non-Therapeutic Pain-Reliever Use (1965 - 2003) | |
|---|---|
 |
 |
 |
 |
Source: National Survey on Drug Use and Health
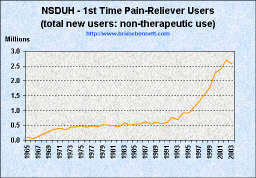
| Trends in Initiation of Non-Therapeutic Pain-Reliever Use (1965 - 2003) | |
|---|---|
|
|
|
|
|
|
Source: National Survey on Drug Use and Health
| YEAR | NUMBER OF INITIATES (1,000s) | MEAN AGE | AGE-SPECIFIC RATES1 | |||
|---|---|---|---|---|---|---|
| All Ages | Under 18 | 18 or Older | 12-17 | 18-25 | ||
| 1965 | 95 | 33 | 62 | 24.9 | * | * |
| 1966 | 52 | 28 | 24 | 19.8 | 1.0 | * |
| 1967 | 128 | 52 | 76 | 19.8 | 2.3 | 2.7 |
| 1968 | 224 | 70 | 154 | 19.9 | 2.9 | 6.1 |
| 1969 | 296 | 150 | 145 | 19.8 | 6.4 | 4.2 |
| 1970 | 367 | 172 | 195 | 19.3 | 6.6 | 5.9 |
| 1971 | 404 | 160 | 244 | 19.6 | 6.7 | 8.1 |
| 1972 | 358 | 133 | 224 | 19.6 | 5.4 | 7.0 |
| 1973 | 431 | 177 | 254 | 19.8 | 7.3 | 7.4 |
| 1974 | 456 | 201 | 256 | 19.4 | 7.7 | 6.9 |
| 1975 | 495 | 177 | 318 | 20.2 | 7.1 | 8.8 |
| 1976 | 443 | 166 | 277 | 20.9 | 7.0 | 6.6 |
| 1977 | 491 | 156 | 335 | 20.2 | 6.5 | 9.8 |
| 1978 | 457 | 173 | 284 | 19.9 | 7.2 | 7.8 |
| 1979 | 526 | 223 | 303 | 20.1 | 10.0 | 7.7 |
| 1980 | 509 | 177 | 332 | 21.6 | 7.8 | 6.7 |
| 1981 | 488 | 127 | 361 | 21.1 | 5.8 | 9.1 |
| 1982 | 460 | 146 | 314 | 21.9 | 6.5 | 6.8 |
| 1983 | 594 | 143 | 451 | 22.2 | 6.6 | 10.3 |
| 1984 | 506 | 113 | 393 | 24.0 | 4.9 | 8.6 |
| 1985 | 540 | 156 | 383 | 21.9 | 6.9 | 9.1 |
| 1986 | 562 | 94 | 467 | 24.3 | 4.5 | 10.0 |
| 1987 | 625 | 138 | 487 | 24.6 | 6.2 | 9.2 |
| 1988 | 538 | 89 | 448 | 24.7 | 4.3 | 9.4 |
| 1989 | 612 | 134 | 478 | 24.2 | 6.6 | 9.9 |
| 1990 | 557 | 115 | 442 | 23.3 | 5.5 | 10.2 |
| 1991 | 604 | 146 | 457 | 23.8 | 6.9 | 9.9 |
| 1992 | 777 | 184 | 593 | 24.5 | 8.3 | 11.7 |
| 1993 | 694 | 173 | 521 | 23.3 | 7.6 | 12.5 |
| 1994 | 932 | 260 | 672 | 24.1 | 11.2 | 13.8 |
| 1995 | 917 | 298 | 618 | 23.0 | 12.5 | 14.2 |
| 1996 | 1,100 | 355 | 744 | 22.0 | 14.8 | 20.4 |
| 1997 | 1,316 | 430 | 886 | 22.1 | 17.3 | 24.0 |
| 1998 | 1,548 | 558 | 990 | 22.7 | 21.9 | 23.5 |
| 1999 | 1,810 | 677 | 1,133 | 22.4 | 26.4 | 27.8 |
| 2000 | 2,268 | 860 | 1,408 | 22.0 | 34.7 | 36.3 |
| 2001 | 2,400 | 1,025 | 1,375 | 21.4 | 41.9 | 35.0 |
| 20022 | 2,699 | 1,154 | 1,545 | 22.0 | 47.8 | 37.5 |
| 20033 | 2,581 | 1,229 | 1,352 | 21.3 | 51.1 | 31.6 |
| *Low precision; no estimate reported. -- Not available. NOTE: Comparisons between years, particularly between recent estimates and those from 10 or more years prior, should be made with caution due to potential bias from reporting and other sources. 1 The numerator of each rate is the number of persons in the age group who initiated use of the drug in the specified year, while the denominator is the person-time exposure of persons in the age group measured in thousands of years. 2 Estimated using 2003 and 2004 data only. 3 Estimated using 2004 data only. Source: SAMHSA, Office of Applied Studies, National Survey on Drug Use and Health, 2002, 2003, and 2004. |
||||||
| truth: the Anti-drugwar | Anti-drugwar Arsenal | Accept the $1 Challenge |