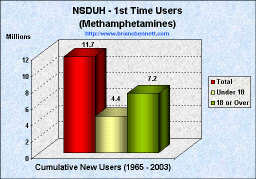
| Trends in Initiation of Non-Therapeutic Methamphetamine Use (1965 - 2003) | |
|---|---|
 |
 |
 |
 |
Source: National Survey on Drug Use and Health
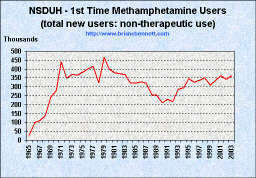
| Trends in Initiation of Non-Therapeutic Methamphetamine Use (1965 - 2003) | |
|---|---|
|
|
|
|
|
|
Source: National Survey on Drug Use and Health
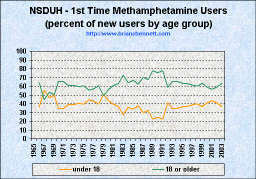
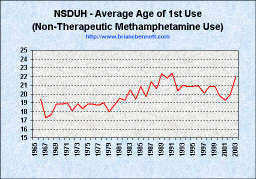
| YEAR | NUMBER OF INITIATES (1,000s) | MEAN AGE | AGE-SPECIFIC RATES1 | |||
|---|---|---|---|---|---|---|
| All Ages | Under 18 | 18 or Older | 12-17 | 18-25 | ||
| 1965 | 28 | * | * | * | * | * |
| 1966 | 97 | 35 | 62 | 19.4 | 1.6 | 2.8 |
| 1967 | 112 | 62 | 50 | 17.3 | 2.9 | 2.2 |
| 1968 | 138 | 65 | 73 | 17.6 | 2.9 | 3.2 |
| 1969 | 241 | 120 | 121 | 18.8 | 5.3 | 4.1 |
| 1970 | 279 | 96 | 184 | 18.8 | 4.2 | 7.1 |
| 1971 | 442 | 153 | 289 | 19.0 | 6.5 | 10.1 |
| 1972 | 349 | 137 | 212 | 18.1 | 5.7 | 7.9 |
| 1973 | 371 | 145 | 226 | 18.9 | 6.1 | 7.1 |
| 1974 | 364 | 148 | 216 | 18.3 | 6.2 | 7.6 |
| 1975 | 382 | 151 | 231 | 18.9 | 6.3 | 7.7 |
| 1976 | 403 | 180 | 223 | 18.8 | 7.6 | 6.9 |
| 1977 | 417 | 179 | 238 | 18.7 | 7.7 | 7.1 |
| 1978 | 322 | 127 | 195 | 19.0 | 5.4 | 6.3 |
| 1979 | 465 | 237 | 228 | 18.0 | 10.7 | 7.1 |
| 1980 | 398 | 174 | 224 | 18.7 | 8.0 | 6.6 |
| 1981 | 379 | 150 | 229 | 19.5 | 7.1 | 6.0 |
| 1982 | 375 | 139 | 236 | 19.3 | 6.5 | 7.0 |
| 1983 | 369 | 102 | 267 | 20.5 | 4.9 | 7.2 |
| 1984 | 324 | 116 | 208 | 19.4 | 5.7 | 5.9 |
| 1985 | 320 | 107 | 214 | 20.8 | 5.3 | 5.3 |
| 1986 | 330 | 124 | 206 | 19.7 | 6.3 | 6.0 |
| 1987 | 321 | 96 | 225 | 21.4 | 4.9 | 5.3 |
| 1988 | 257 | 83 | 174 | 20.6 | 4.3 | 4.8 |
| 1989 | 253 | 57 | 196 | 22.3 | 2.9 | 5.2 |
| 1990 | 211 | 52 | 159 | 21.8 | 2.6 | 4.1 |
| 1991 | 231 | 51 | 180 | 22.4 | 2.6 | 4.4 |
| 1992 | 215 | 88 | 127 | 20.4 | 4.4 | 3.2 |
| 1993 | 286 | 98 | 188 | 21.0 | 4.9 | 5.0 |
| 1994 | 296 | 103 | 193 | 20.8 | 5.0 | 5.2 |
| 1995 | 345 | 126 | 219 | 20.9 | 5.8 | 6.2 |
| 1996 | 327 | 122 | 205 | 20.9 | 5.5 | 5.7 |
| 1997 | 336 | 130 | 206 | 20.1 | 5.7 | 5.8 |
| 1998 | 352 | 140 | 212 | 20.8 | 6.0 | 5.2 |
| 1999 | 308 | 112 | 196 | 20.9 | 4.6 | 5.2 |
| 2000 | 337 | 139 | 198 | 19.8 | 5.7 | 5.5 |
| 2001 | 362 | 157 | 205 | 19.3 | 6.3 | 5.7 |
| 20022 | 343 | 140 | 203 | 19.9 | 5.5 | 5.1 |
| 20033 | 363 | 132 | 231 | 22.0 | 5.2 | 4.5 |
| *Low precision; no estimate reported. -- Not available. NOTE: Comparisons between years, particularly between recent estimates and those from 10 or more years prior, should be made with caution due to potential bias from reporting and other sources. 1 The numerator of each rate is the number of persons in the age group who initiated use of the drug in the specified year, while the denominator is the person-time exposure of persons in the age group measured in thousands of years. 2 Estimated using 2003 and 2004 data only. 3 Estimated using 2004 data only. Source: SAMHSA, Office of Applied Studies, National Survey on Drug Use and Health, 2002, 2003, and 2004. |
||||||
| truth: the Anti-drugwar | Anti-drugwar Arsenal | Accept the $1 Challenge |