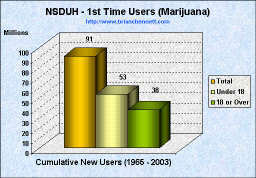
| Trends in Initiation of Marijuana Use (1965 - 2003) | |
|---|---|
 |
 |
 |
 |
Source: National Survey on Drug Use and Health
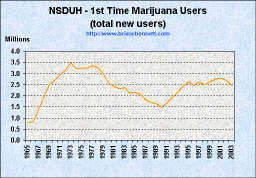
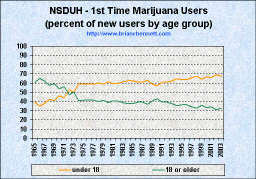
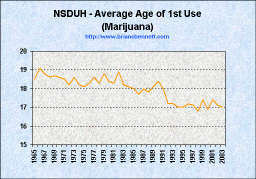
| Trends in Initiation of Marijuana Use (1965 - 2003) | |
|---|---|
|
|
|
|
|
|
Source: National Survey on Drug Use and Health
| YEAR | NUMBER OF INITIATES (1,000s) | MEAN AGE | AGE-SPECIFIC RATES1 | |||
|---|---|---|---|---|---|---|
| All Ages | Under 18 | 18 or Older | 12-17 | 18-25 | ||
| 1965 | 777 | 309 | 468 | 18.5 | 14.8 | 23.5 |
| 1966 | 832 | 289 | 543 | 19.1 | 13.0 | 24.9 |
| 1967 | 1,397 | 530 | 868 | 18.8 | 24.9 | 37.3 |
| 1968 | 1,980 | 842 | 1,139 | 18.6 | 38.6 | 49.2 |
| 1969 | 2,462 | 1,002 | 1,461 | 18.7 | 46.3 | 66.1 |
| 1970 | 2,692 | 1,238 | 1,454 | 18.6 | 57.6 | 64.3 |
| 1971 | 2,954 | 1,308 | 1,646 | 18.5 | 59.8 | 76.3 |
| 1972 | 3,164 | 1,665 | 1,500 | 18.2 | 77.2 | 66.1 |
| 1973 | 3,490 | 1,741 | 1,749 | 18.6 | 80.4 | 79.3 |
| 1974 | 3,222 | 1,912 | 1,311 | 18.2 | 90.6 | 59.5 |
| 1975 | 3,227 | 1,889 | 1,339 | 18.1 | 91.0 | 63.2 |
| 1976 | 3,226 | 1,896 | 1,331 | 18.3 | 94.9 | 65.1 |
| 1977 | 3,345 | 1,967 | 1,378 | 18.6 | 100.3 | 66.4 |
| 1978 | 3,289 | 1,991 | 1,298 | 18.3 | 104.8 | 67.1 |
| 1979 | 2,996 | 1,760 | 1,236 | 18.8 | 95.0 | 60.6 |
| 1980 | 2,573 | 1,581 | 992 | 18.4 | 86.0 | 51.2 |
| 1981 | 2,438 | 1,440 | 998 | 18.3 | 80.7 | 56.3 |
| 1982 | 2,323 | 1,393 | 930 | 18.9 | 77.9 | 47.1 |
| 1983 | 2,351 | 1,443 | 908 | 18.2 | 80.6 | 52.7 |
| 1984 | 2,113 | 1,324 | 789 | 18.1 | 76.0 | 44.3 |
| 1985 | 2,165 | 1,357 | 808 | 18.0 | 77.9 | 48.0 |
| 1986 | 2,062 | 1,258 | 805 | 17.7 | 74.2 | 49.5 |
| 1987 | 1,823 | 1,113 | 710 | 18.0 | 64.5 | 44.6 |
| 1988 | 1,702 | 1,075 | 627 | 17.8 | 64.2 | 40.1 |
| 1989 | 1,647 | 971 | 675 | 18.1 | 57.1 | 40.6 |
| 1990 | 1,482 | 843 | 639 | 18.4 | 48.1 | 36.7 |
| 1991 | 1,694 | 1,031 | 662 | 18.0 | 58.0 | 39.0 |
| 1992 | 1,920 | 1,167 | 753 | 17.2 | 64.0 | 47.2 |
| 1993 | 2,154 | 1,349 | 805 | 17.2 | 72.9 | 47.2 |
| 1994 | 2,420 | 1,568 | 852 | 17.0 | 84.6 | 52.0 |
| 1995 | 2,635 | 1,674 | 961 | 17.0 | 88.8 | 57.8 |
| 1996 | 2,483 | 1,579 | 903 | 17.2 | 82.9 | 54.4 |
| 1997 | 2,603 | 1,716 | 887 | 17.1 | 89.3 | 54.2 |
| 1998 | 2,498 | 1,684 | 814 | 16.8 | 85.2 | 51.3 |
| 1999 | 2,640 | 1,691 | 950 | 17.4 | 84.8 | 57.4 |
| 2000 | 2,746 | 1,834 | 912 | 16.9 | 91.3 | 56.0 |
| 2001 | 2,793 | 1,833 | 960 | 17.4 | 90.9 | 57.1 |
| 20022 | 2,686 | 1,861 | 825 | 17.1 | 91.1 | 49.1 |
| 20033 | 2,463 | 1,655 | 809 | 17.0 | 79.7 | 46.8 |
| *Low precision; no estimate reported. -- Not available. NOTE: Comparisons between years, particularly between recent estimates and those from 10 or more years prior, should be made with caution due to potential bias from reporting and other sources. 1 The numerator of each rate is the number of persons in the age group who initiated use of the drug in the specified year, while the denominator is the person-time exposure of persons in the age group measured in thousands of years. 2 Estimated using 2003 and 2004 data only. 3 Estimated using 2004 data only. Source: SAMHSA, Office of Applied Studies, National Survey on Drug Use and Health, 2002, 2003, and 2004. |
||||||
| truth: the Anti-drugwar | Anti-drugwar Arsenal | Accept the $1 Challenge |