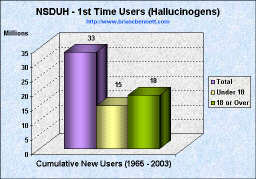
| Trends in Initiation of Hallucinogen Use (1965 - 2003) | |
|---|---|
 |
 |
 |
 |
Source: National Survey on Drug Use and Health
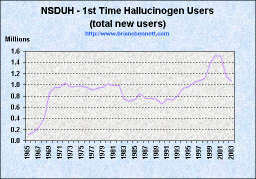
| Trends in Initiation of Hallucinogen Use (1965 - 2003) | |
|---|---|
|
|
|
|
|
|
Source: National Survey on Drug Use and Health
| YEAR | NUMBER OF INITIATES (1,000s) | MEAN AGE | AGE-SPECIFIC RATES1 | |||
|---|---|---|---|---|---|---|
| All Ages | Under 18 | 18 or Older | 12-17 | 18-25 | ||
| 1965 | 104 | 41 | 63 | 17.9 | 2.0 | 3.2 |
| 1966 | 146 | 59 | 87 | 19.8 | 2.7 | 3.5 |
| 1967 | 245 | 92 | 153 | 18.7 | 4.1 | 6.0 |
| 1968 | 393 | 188 | 204 | 18.7 | 8.3 | 7.3 |
| 1969 | 846 | 322 | 524 | 18.8 | 14.1 | 20.5 |
| 1970 | 945 | 408 | 537 | 18.3 | 18.0 | 21.6 |
| 1971 | 958 | 488 | 470 | 18.0 | 21.4 | 17.8 |
| 1972 | 1,041 | 521 | 521 | 17.7 | 22.6 | 19.8 |
| 1973 | 956 | 466 | 491 | 18.1 | 19.9 | 18.2 |
| 1974 | 970 | 481 | 489 | 18.7 | 20.4 | 16.6 |
| 1975 | 972 | 462 | 510 | 18.2 | 19.8 | 19.1 |
| 1976 | 953 | 441 | 512 | 19.1 | 19.1 | 17.8 |
| 1977 | 907 | 398 | 510 | 18.8 | 17.4 | 18.2 |
| 1978 | 943 | 452 | 491 | 18.2 | 19.9 | 17.8 |
| 1979 | 953 | 467 | 486 | 18.4 | 21.4 | 15.9 |
| 1980 | 1,015 | 439 | 576 | 19.1 | 20.6 | 18.6 |
| 1981 | 982 | 385 | 597 | 19.3 | 18.6 | 19.9 |
| 1982 | 985 | 383 | 602 | 20.0 | 18.5 | 18.9 |
| 1983 | 743 | 286 | 456 | 19.1 | 14.0 | 15.9 |
| 1984 | 705 | 263 | 442 | 19.3 | 13.0 | 15.1 |
| 1985 | 744 | 323 | 421 | 18.6 | 16.0 | 14.9 |
| 1986 | 837 | 328 | 509 | 19.4 | 16.9 | 17.2 |
| 1987 | 751 | 319 | 432 | 19.2 | 16.6 | 15.3 |
| 1988 | 757 | 296 | 461 | 19.1 | 15.8 | 16.2 |
| 1989 | 742 | 279 | 462 | 19.1 | 14.8 | 16.3 |
| 1990 | 654 | 283 | 371 | 19.5 | 15.1 | 12.1 |
| 1991 | 751 | 329 | 422 | 18.8 | 17.4 | 15.6 |
| 1992 | 726 | 332 | 394 | 18.8 | 16.9 | 14.1 |
| 1993 | 807 | 380 | 427 | 19.1 | 19.1 | 14.6 |
| 1994 | 943 | 470 | 473 | 18.1 | 23.3 | 18.4 |
| 1995 | 962 | 473 | 489 | 18.2 | 22.7 | 19.0 |
| 1996 | 1,050 | 510 | 540 | 18.8 | 23.9 | 21.1 |
| 1997 | 1,077 | 501 | 576 | 18.8 | 22.7 | 22.5 |
| 1998 | 1,104 | 514 | 590 | 18.8 | 22.5 | 21.9 |
| 1999 | 1,383 | 617 | 766 | 18.6 | 26.7 | 30.3 |
| 2000 | 1,522 | 664 | 858 | 19.1 | 28.2 | 32.1 |
| 2001 | 1,511 | 681 | 830 | 19.2 | 28.5 | 29.3 |
| 20022 | 1,141 | 530 | 610 | 18.6 | 21.5 | 22.0 |
| 20033 | 1,065 | 526 | 539 | 18.9 | 21.1 | 18.0 |
| *Low precision; no estimate reported. -- Not available. NOTE: Comparisons between years, particularly between recent estimates and those from 10 or more years prior, should be made with caution due to potential bias from reporting and other sources. 1 The numerator of each rate is the number of persons in the age group who initiated use of the drug in the specified year, while the denominator is the person-time exposure of persons in the age group measured in thousands of years. 2 Estimated using 2003 and 2004 data only. 3 Estimated using 2004 data only. Source: SAMHSA, Office of Applied Studies, National Survey on Drug Use and Health, 2002, 2003, and 2004. |
||||||
| truth: the Anti-drugwar | Anti-drugwar Arsenal | Accept the $1 Challenge |