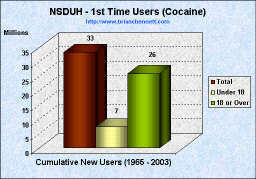
| Trends in Initiation of Cocaine Use (1965 - 2003) | |
|---|---|
 |
 |
 |
 |
Source: National Survey on Drug Use and Health
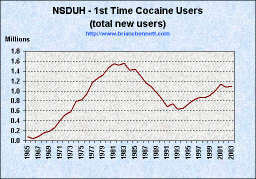
| Trends in Initiation of Cocaine Use (1965 - 2003) | |
|---|---|
|
|
|
|
|
|
Source: National Survey on Drug Use and Health
| YEAR | NUMBER OF INITIATES (1,000s) | MEAN AGE | AGE-SPECIFIC RATES1 | |||
|---|---|---|---|---|---|---|
| All Ages | Under 18 | 18 or Older | 12-17 | 18-25 | ||
| 1965 | 80 | * | 61 | 20.7 | * | 2.2 |
| 1966 | 41 | * | 36 | 22.5 | * | * |
| 1967 | 87 | * | 80 | 23.6 | * | 2.9 |
| 1968 | 162 | 49 | 113 | 20.2 | 2.2 | 4.2 |
| 1969 | 187 | 46 | 141 | 21.0 | 1.8 | 4.5 |
| 1970 | 266 | 76 | 189 | 19.3 | 3.3 | 7.1 |
| 1971 | 413 | 93 | 320 | 20.6 | 3.9 | 10.5 |
| 1972 | 520 | 136 | 384 | 19.3 | 5.6 | 13.4 |
| 1973 | 586 | 162 | 424 | 20.3 | 6.8 | 13.6 |
| 1974 | 792 | 191 | 601 | 21.4 | 7.9 | 16.8 |
| 1975 | 827 | 169 | 658 | 21.1 | 7.0 | 18.9 |
| 1976 | 937 | 194 | 743 | 21.1 | 8.2 | 23.2 |
| 1977 | 1,165 | 247 | 917 | 21.5 | 10.6 | 24.9 |
| 1978 | 1,255 | 226 | 1,029 | 21.4 | 9.9 | 29.9 |
| 1979 | 1,315 | 240 | 1,075 | 20.8 | 10.8 | 33.6 |
| 1980 | 1,457 | 293 | 1,163 | 22.0 | 13.4 | 31.5 |
| 1981 | 1,546 | 308 | 1,238 | 21.3 | 14.3 | 36.6 |
| 1982 | 1,518 | 271 | 1,248 | 22.6 | 12.9 | 33.5 |
| 1983 | 1,557 | 254 | 1,303 | 22.2 | 12.3 | 37.5 |
| 1984 | 1,419 | 272 | 1,147 | 22.0 | 13.5 | 33.2 |
| 1985 | 1,441 | 281 | 1,159 | 22.3 | 14.2 | 32.9 |
| 1986 | 1,315 | 256 | 1,059 | 22.8 | 13.2 | 30.4 |
| 1987 | 1,162 | 239 | 923 | 22.3 | 12.4 | 27.7 |
| 1988 | 1,084 | 175 | 909 | 22.7 | 9.2 | 26.9 |
| 1989 | 968 | 154 | 814 | 23.0 | 8.0 | 23.6 |
| 1990 | 843 | 162 | 682 | 23.2 | 8.6 | 19.0 |
| 1991 | 687 | 121 | 566 | 22.9 | 6.2 | 15.8 |
| 1992 | 747 | 160 | 587 | 24.5 | 8.1 | 14.3 |
| 1993 | 634 | 143 | 491 | 23.1 | 7.1 | 13.4 |
| 1994 | 655 | 160 | 494 | 22.5 | 7.5 | 14.1 |
| 1995 | 744 | 214 | 530 | 21.3 | 10.1 | 16.7 |
| 1996 | 825 | 244 | 581 | 21.6 | 11.2 | 17.9 |
| 1997 | 861 | 243 | 618 | 20.8 | 10.9 | 20.7 |
| 1998 | 868 | 264 | 605 | 20.9 | 11.5 | 19.5 |
| 1999 | 917 | 270 | 648 | 21.1 | 11.5 | 20.2 |
| 2000 | 1,002 | 289 | 714 | 20.8 | 12.0 | 23.0 |
| 2001 | 1,140 | 335 | 805 | 20.9 | 13.7 | 24.9 |
| 20022 | 1,073 | 333 | 740 | 20.3 | 13.5 | 22.8 |
| 20033 | 1,094 | 384 | 710 | 19.8 | 15.3 | 23.0 |
| *Low precision; no estimate reported. -- Not available. NOTE: Comparisons between years, particularly between recent estimates and those from 10 or more years prior, should be made with caution due to potential bias from reporting and other sources. 1 The numerator of each rate is the number of persons in the age group who initiated use of the drug in the specified year, while the denominator is the person-time exposure of persons in the age group measured in thousands of years. 2 Estimated using 2003 and 2004 data only. 3 Estimated using 2004 data only. Source: SAMHSA, Office of Applied Studies, National Survey on Drug Use and Health, 2002, 2003, and 2004. |
||||||
| truth: the Anti-drugwar | Anti-drugwar Arsenal | Accept the $1 Challenge |