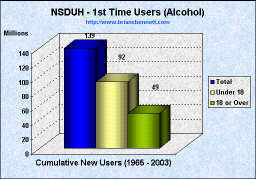
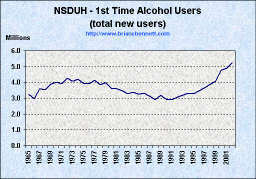
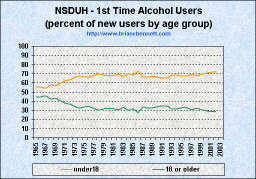
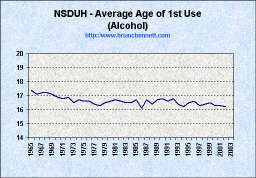
| Trends in Initiation of Alcohol Use (1965 - 2003) | |
|---|---|
 |
 |
 |
 |
Source: National Survey on Drug Use and Health
| Trends in Initiation of Alcohol Use (1965 - 2003) | |
|---|---|
 |
 |
 |
 |
Source: National Survey on Drug Use and Health
| YEAR | NUMBER OF INITIATES (1,000s) | MEAN AGE | AGE-SPECIFIC RATES1 | |||
|---|---|---|---|---|---|---|
| All Ages | Under 18 | 18 or Older | 12-17 | 18-25 | ||
| 1965 | 3,261 | 1,817 | 1,444 | 17.4 | 96.1 | 223.0 |
| 1966 | 2,968 | 1,638 | 1,330 | 17.1 | 86.6 | 213.3 |
| 1967 | 3,604 | 1,959 | 1,645 | 17.2 | 104.4 | 246.2 |
| 1968 | 3,552 | 2,059 | 1,493 | 17.2 | 108.2 | 216.3 |
| 1969 | 3,893 | 2,213 | 1,679 | 17.1 | 115.3 | 259.3 |
| 1970 | 4,003 | 2,390 | 1,613 | 16.9 | 122.2 | 261.0 |
| 1971 | 3,922 | 2,441 | 1,481 | 16.8 | 125.4 | 239.0 |
| 1972 | 4,272 | 2,703 | 1,569 | 16.9 | 141.9 | 260.1 |
| 1973 | 4,072 | 2,685 | 1,387 | 16.5 | 142.7 | 234.9 |
| 1974 | 4,211 | 2,845 | 1,366 | 16.7 | 153.4 | 233.1 |
| 1975 | 3,919 | 2,597 | 1,322 | 16.6 | 140.9 | 226.0 |
| 1976 | 3,930 | 2,600 | 1,330 | 16.6 | 142.6 | 229.0 |
| 1977 | 4,130 | 2,811 | 1,319 | 16.4 | 158.8 | 242.3 |
| 1978 | 3,852 | 2,702 | 1,150 | 16.3 | 159.2 | 209.8 |
| 1979 | 3,993 | 2,721 | 1,273 | 16.5 | 167.1 | 235.4 |
| 1980 | 3,626 | 2,453 | 1,173 | 16.6 | 155.1 | 220.8 |
| 1981 | 3,606 | 2,461 | 1,145 | 16.7 | 158.9 | 214.7 |
| 1982 | 3,466 | 2,403 | 1,063 | 16.6 | 152.9 | 202.9 |
| 1983 | 3,289 | 2,199 | 1,090 | 16.5 | 141.4 | 217.7 |
| 1984 | 3,365 | 2,367 | 998 | 16.5 | 156.6 | 198.4 |
| 1985 | 3,263 | 2,237 | 1,026 | 16.7 | 149.6 | 212.7 |
| 1986 | 3,316 | 2,404 | 912 | 16.1 | 165.0 | 192.6 |
| 1987 | 3,119 | 2,063 | 1,057 | 16.7 | 144.7 | 218.4 |
| 1988 | 2,909 | 1,971 | 938 | 16.4 | 138.9 | 194.7 |
| 1989 | 3,195 | 2,140 | 1,055 | 16.7 | 152.3 | 210.2 |
| 1990 | 2,933 | 1,941 | 993 | 16.8 | 135.3 | 198.0 |
| 1991 | 2,890 | 1,875 | 1,015 | 16.6 | 125.7 | 211.1 |
| 1992 | 3,059 | 2,009 | 1,050 | 16.8 | 128.9 | 207.5 |
| 1993 | 3,190 | 2,192 | 998 | 16.4 | 138.4 | 198.0 |
| 1994 | 3,311 | 2,260 | 1,051 | 16.2 | 137.5 | 206.5 |
| 1995 | 3,299 | 2,218 | 1,081 | 16.5 | 132.4 | 209.1 |
| 1996 | 3,473 | 2,338 | 1,136 | 16.6 | 134.5 | 221.3 |
| 1997 | 3,668 | 2,538 | 1,130 | 16.3 | 141.8 | 220.4 |
| 1998 | 3,882 | 2,633 | 1,248 | 16.4 | 145.8 | 238.8 |
| 1999 | 4,072 | 2,832 | 1,240 | 16.5 | 155.6 | 233.2 |
| 2000 | 4,764 | 3,358 | 1,407 | 16.3 | 191.6 | 273.3 |
| 20012 | 4,906 | 3,500 | 1,406 | 16.3 | 200.7 | 277.4 |
| 20023 | 5,240 | 3,748 | 1,492 | 16.2 | 216.6 | 290.0 |
| 20033 | -- | -- | 1,442 | -- | 228.2 | 284.1 |
| *Low precision; no estimate reported. -- Not available. NOTE: Comparisons between years, particularly between recent estimates and those from 10 or more years prior, should be made with caution due to potential bias from reporting and other sources. 1 The numerator of each rate is the number of persons in the age group who initiated use of the drug in the specified year, while the denominator is the person-time exposure of persons in the age group measured in thousands of years. 2 Estimated using 2003 and 2004 data only. 3 Estimated using 2004 data only. Source: SAMHSA, Office of Applied Studies, National Survey on Drug Use and Health, 2002, 2003, and 2004. |
||||||
| truth: the Anti-drugwar | Anti-drugwar Arsenal | Accept the $1 Challenge |