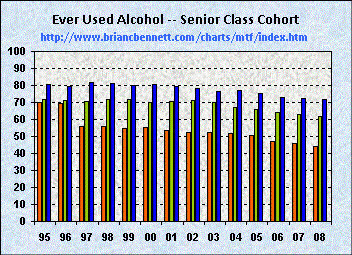
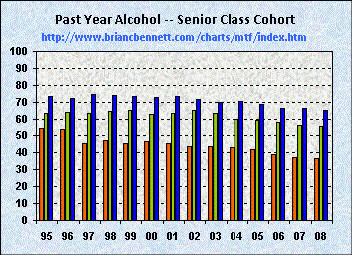
| Alcohol Use Within Cohort -- High School Classes of 1995 through 2003 | ||
|---|---|---|
| Lifetime | Past Year | Past Month |
 |
 |
 |
Click a graph to drill down to its data
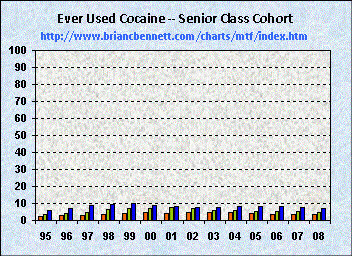
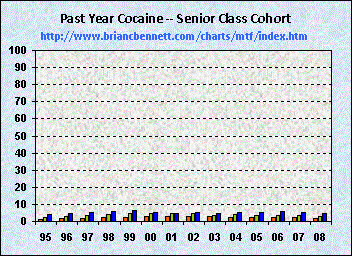
| Cocaine Use Within Cohort -- High School Classes of 1995 through 2003 | ||
|---|---|---|
| Lifetime | Past Year | Past Month |
 |
 |
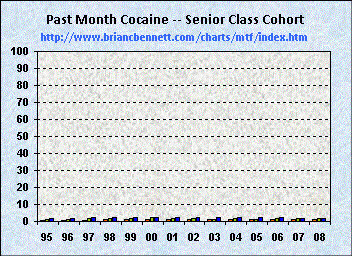 |
Click a graph to drill down to its data
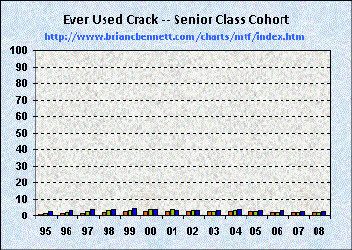
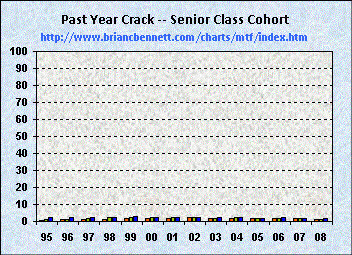
| Crack Use Within Cohort -- High School Classes of 1995 through 2003 | ||
|---|---|---|
| Lifetime | Past Year | Past Month |
 |
 |
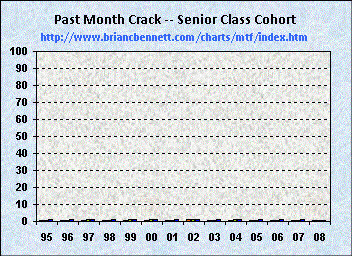 |
Click a graph to drill down to its data
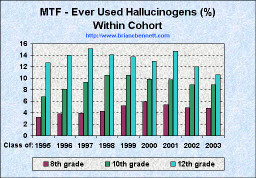
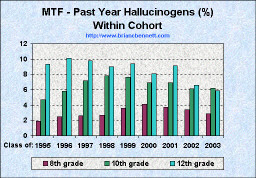
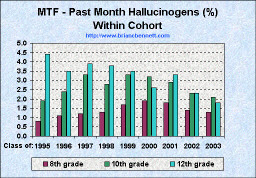
| Hallucinogen Use Within Cohort -- High School Classes of 1995 through 2003 | ||
|---|---|---|
| Lifetime | Past Year | Past Month |
 |
 |
 |
Click a graph to drill down to its data
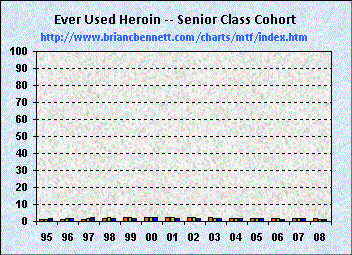
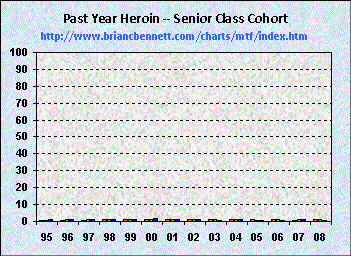
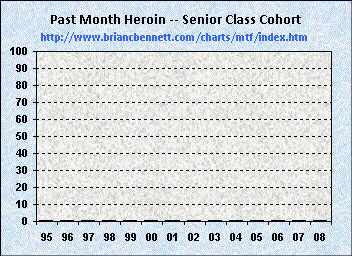
| Heroin Use Within Cohort -- High School Classes of 1995 through 2003 | ||
|---|---|---|
| Lifetime | Past Year | Past Month |
 |
 |
 |
Click a graph to drill down to its data
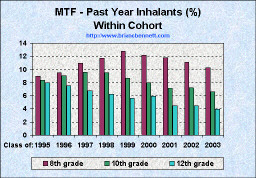
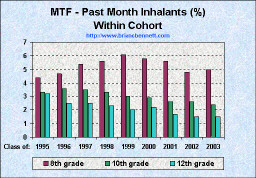
| Inhalant Use Within Cohort -- High School Classes of 1995 through 2003 | ||
|---|---|---|
| Lifetime | Past Year | Past Month |
 |
 |
 |
Click a graph to drill down to its data
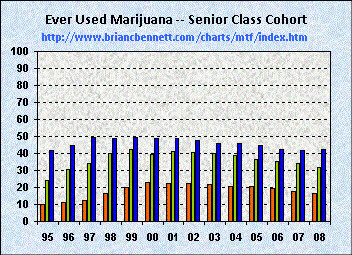
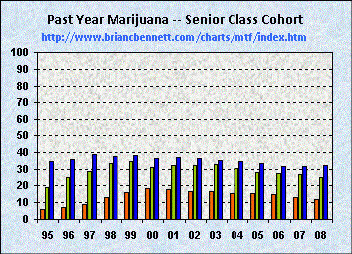
| Marijuana Use Within Cohort -- High School Classes of 1995 through 2003 | ||
|---|---|---|
| Lifetime | Past Year | Past Month |
 |
 |
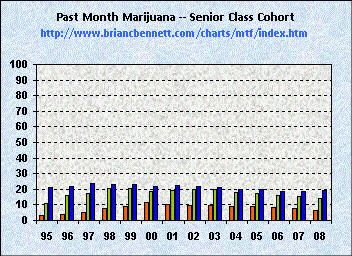 |
Click a graph to drill down to its data
Source: University of Michigan, Monitoring The Future Studies