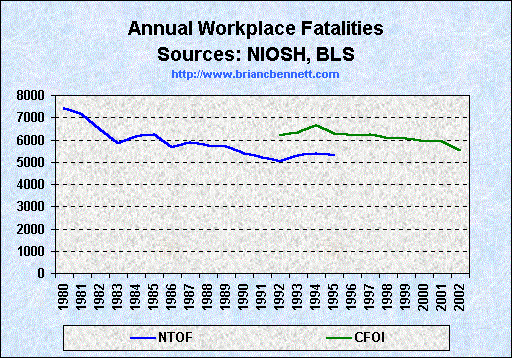
Trends in Workplace Fatalities (1980 - 2002)

| Trends in Work Place Fatalities (1980 - 2002) | ||
|---|---|---|
| Year | NTOF tally | CFOI tally |
| 1980 | 7,405 | -- |
| 1981 | 7,136 | -- |
| 1982 | 6,459 | -- |
| 1983 | 5,856 | -- |
| 1984 | 6,162 | -- |
| 1985 | 6,250 | -- |
| 1986 | 5,671 | -- |
| 1987 | 5,884 | -- |
| 1988 | 5,751 | -- |
| 1989 | 5,714 | -- |
| 1990 | 5,384 | -- |
| 1991 | 5,219 | -- |
| 1992 | 5,032 | 6,217 |
| 1993 | 5,286 | 6,331 |
| 1994 | 5,406 | 6,632 |
| 1995 | 5,314 | 6,275 |
| 1996 | -- | 6,202 |
| 1997 | -- | 6,238 |
| 1998 | -- | 6,055 |
| 1999 | -- | 6,054 |
| 2000 | -- | 5,920 |
| 2001 | -- | 5,915 |
| 2002 | -- | 5,524 |
Sources:
Bureau of Labor Statistics
National Institute for Occupational Safety and Health