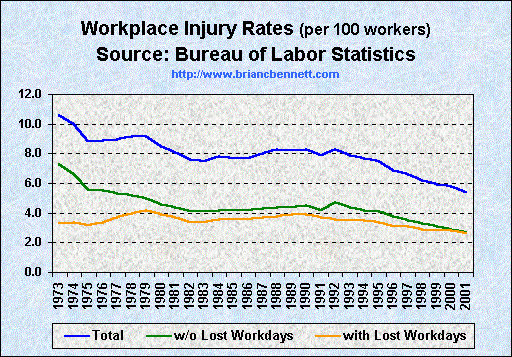
Trends in Workplace Injury Rates (1973 - 2001)

| Trends in Work Place Injury Rates (1973 - 2001) | |||
|---|---|---|---|
| Year | Overall | w/o Lost Days | with Lost Days |
| 1973 | 10.6 | 7.3 | 3.3 |
| 1974 | 10.0 | 6.6 | 3.4 |
| 1975 | 8.8 | 5.6 | 3.2 |
| 1976 | 8.9 | 5.5 | 3.4 |
| 1977 | 9.0 | 5.3 | 3.7 |
| 1978 | 9.2 | 5.2 | 4.0 |
| 1979 | 9.2 | 5.0 | 4.2 |
| 1980 | 8.5 | 4.6 | 3.9 |
| 1981 | 8.1 | 4.4 | 3.7 |
| 1982 | 7.6 | 4.1 | 3.4 |
| 1983 | 7.5 | 4.1 | 3.4 |
| 1984 | 7.8 | 4.2 | 3.6 |
| 1985 | 7.7 | 4.2 | 3.6 |
| 1986 | 7.7 | 4.2 | 3.6 |
| 1987 | 8.0 | 4.3 | 3.7 |
| 1988 | 8.3 | 4.4 | 3.8 |
| 1989 | 8.2 | 4.4 | 3.9 |
| 1990 | 8.3 | 4.5 | 3.9 |
| 1991 | 7.9 | 4.2 | 3.7 |
| 1992 | 8.3 | 4.7 | 3.6 |
| 1993 | 7.9 | 4.4 | 3.5 |
| 1994 | 7.7 | 4.2 | 3.5 |
| 1995 | 7.5 | 4.1 | 3.4 |
| 1996 | 6.9 | 3.8 | 3.1 |
| 1997 | 6.6 | 3.5 | 3.1 |
| 1998 | 6.2 | 3.3 | 2.9 |
| 1999 | 5.9 | 3.1 | 2.8 |
| 2000 | 5.8 | 2.9 | 2.8 |
| 2001 | 5.4 | 2.7 | 2.6 |
Source: Bureau of Labor Statistics, Workplace Injuries and Illnesses in 2001