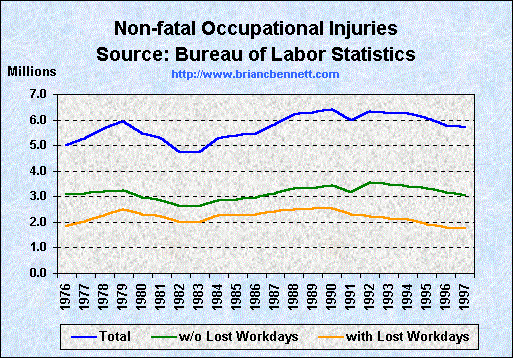
Trends in Workplace Injuries (1976 - 1997)

| Trends in Work Place Injuries (1976 - 1997) | |||
|---|---|---|---|
| Year | Total | w/o Lost Days | with Lost Days |
| 1976 | 4,995,800 | 3,073,500 | 1,821,400 |
| 1977 | 5,298,500 | 3,145,900 | 2,041,700 |
| 1978 | 5,656,000 | 3,212,500 | 2,280,800 |
| 1979 | 5,956,800 | 3,250,400 | 2,505,100 |
| 1980 | 5,475,600 | 2,979,800 | 2,311,900 |
| 1981 | 5,278,400 | 2,864,900 | 2,227,800 |
| 1982 | 4,751,000 | 2,604,500 | 1,981,400 |
| 1983 | 4,748,000 | 2,604,500 | 1,978,700 |
| 1984 | 5,294,800 | 2,841,100 | 2,260,600 |
| 1985 | 5,381,700 | 2,893,100 | 2,275,900 |
| 1986 | 5,492,000 | 2,955,100 | 2,311,300 |
| 1987 | 5,845,500 | 3,120,800 | 2,425,200 |
| 1988 | 6,199,600 | 3,315,600 | 2,518,700 |
| 1989 | 6,292,500 | 3,333,000 | 2,546,500 |
| 1990 | 6,421,300 | 3,430,800 | 2,528,100 |
| 1991 | 5,977,400 | 3,180,500 | 2,308,600 |
| 1992 | 6,342,000 | 3,565,900 | 2,226,000 |
| 1993 | 6,255,300 | 3,482,900 | 2,135,600 |
| 1994 | 6,252,200 | 3,403,900 | 2,119,300 |
| 1995 | 6,080,600 | 3,313,000 | 1,934,300 |
| 1996 | 5,799,900 | 3,153,600 | 1,785,800 |
| 1997 | 5,715,800 | 3,033,200 | 1,746,500 |
Source:
Bureau of Labor Statistics
Survey of Occupational Illness and Injury