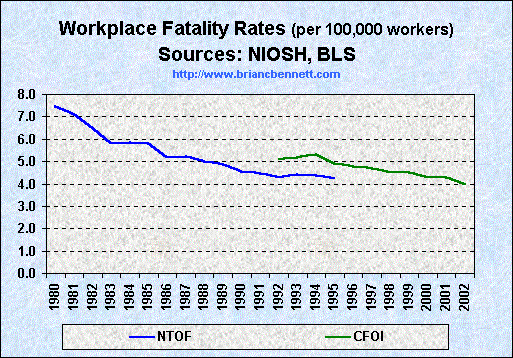
Trends in Workplace Fatality Rates (1980 - 2002)

| Trends in Work Place Fatality Rates (1980 - 2002) | ||
|---|---|---|
| Year | NTOF Rate | CFOI Rate |
| 1980 | 7.5 | -- |
| 1981 | 7.1 | -- |
| 1982 | 6.5 | -- |
| 1983 | 5.8 | -- |
| 1984 | 5.9 | -- |
| 1985 | 5.8 | -- |
| 1986 | 5.2 | -- |
| 1987 | 5.2 | -- |
| 1988 | 5.0 | -- |
| 1989 | 4.9 | -- |
| 1990 | 4.6 | -- |
| 1991 | 4.5 | -- |
| 1992 | 4.3 | 5.1 |
| 1993 | 4.4 | 5.2 |
| 1994 | 4.4 | 5.3 |
| 1995 | 4.3 | 4.9 |
| 1996 | -- | 4.8 |
| 1997 | -- | 4.7 |
| 1998 | -- | 4.5 |
| 1999 | -- | 4.5 |
| 2000 | -- | 4.3 |
| 2001 | -- | 4.3 |
| 2002 | -- | 4.0 |
Source:
Bureau of Labor Statistics
National Institute for Occupational Safety and Health