| Should we really be concerned about this? | |
|---|---|
 |
 |
Sources: ONDCP 2002 Drug Control Strategy
Centers for Disease Control, CDC Wonder System
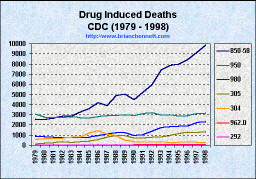
"Drug-Related Deaths. The Centers for Disease Control and Prevention (CDC) estimate that 19,102 people died in 1999 (or 52 such deaths per day) as the direct result of drug-induced causes. Although current CDC data are not directly comparable with prior-year estimates, there was a steady increase in drug induced deaths between 1990 and 1998 -- from 9,463 to 16,926." -- ONDCP 2002 National Drug Control Strategy, p.29
| Should we really be concerned about this? | |
|---|---|
|
|
|
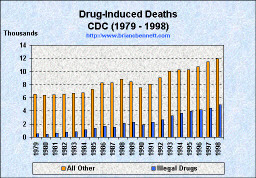
There are several reasons why we should not be alarmed at all by the oft-quoted statistics about "drug-induced" deaths. The first reason is that 20,000 deaths is a pitifully small number in the face of the fact that some 2.4 million deaths occur annually in the US. Within the context of the drugwar however, what is important is how few deaths among even this incredibly small number are actually due to illegal drugs. The way the drug warriors talk, you'd think that all these deaths are due to overdoses of heroin or cocaine. As usual, the truth of the matter is far different from what we are being told.
Below is a table of all deaths in the US and the total number of deaths from 1979-1998 listed as "drug-induced," followed by another table with the breakdown of the ICD-9 codes and total deaths attributed to each cause for the cumulative 20 years. Remember, we're being told that we need to spend $20 billion a year, wrecking countless lives in the process, in part due to the spectre of death from "drugs."
| Total Deaths vs Drug-Induced | |||
|---|---|---|---|
| All Deaths | Drug-Induced | ||
| Year | Total Deaths | Number | % of All Deaths |
| 1979 | 1,913,841 | 7,101 | 0.371 |
| 1980 | 1,989,841 | 6,900 | 0.347 |
| 1981 | 1,977,981 | 7,106 | 0.359 |
| 1982 | 1,974,797 | 7,310 | 0.370 |
| 1983 | 2,019,201 | 7,492 | 0.371 |
| 1984 | 2,039,369 | 7,892 | 0.387 |
| 1985 | 2,086,440 | 8,663 | 0.415 |
| 1986 | 2,105,361 | 9,976 | 0.474 |
| 1987 | 2,123,323 | 9,796 | 0.461 |
| 1988 | 2,167,999 | 10,917 | 0.504 |
| 1989 | 2,150,466 | 10,710 | 0.498 |
| 1990 | 2,148,463 | 9,463 | 0.440 |
| 1991 | 2,169,518 | 10,388 | 0.479 |
| 1992 | 2,175,613 | 11,703 | 0.538 |
| 1993 | 2,268,553 | 13,275 | 0.585 |
| 1994 | 2,278,994 | 13,923 | 0.611 |
| 1995 | 2,312,132 | 14,218 | 0.615 |
| 1996 | 2,314,690 | 14,843 | 0.641 |
| 1997 | 2,314,245 | 15,973 | 0.690 |
| 1998 | 2,337,256 | 16,926 | 0.724 |
| Grand Total | 42,868,083 | 214,575 | 0.501 |
The breakdown of death categorizations included in the tally of "drug-induced" deaths includes these ICD-9 codes: 292, 304, 305.2-305.9, E850-E858, E950.0-E950.5, E962.0, E980.0-E980.5
The meanings of the codes and the cumulative 20 year death totals for each cause are as follows:
| ICD-9 Code | Classification | Cumulative Deaths | % of Drug-induced |
| 292 | Drug psychoses | 140 | 0.065 |
| 304 | Drug dependence | 11,897 | 5.55 |
| 305.2-9 | Nondependent abuse of drugs | 13,992 | 6.52 |
| E850-E858 | Accidental Poisoning | 104,554 | 48.72 |
| E950.0-5 | Suicide | 58,208 | 27.13 |
| E962.0 | Homicidal poisoning by drug | 534 | 0.25 |
| E980.0-5 | Poisoning (intent undetermined) | 25,250 | 11.77 |
Clearly, as we can see from this table and the chart above, the vast majority of deaths due to drug-induced causes can be lumped into two categories: accidental overdose (850-58) and suicide by drug (950.0-5) which together account for about 76 percent of all such deaths for the 20-year period 1979-1998.
What we really need to know, however, is exactly how many of these drug-induced deaths are caused by illegal drugs. Afterall, if we are trying to justify jailing people over this sort of self-directed activity, it would behoove us to have as clear a picture as possible of what is actually going on.
| truth: the Anti-drugwar | Anti-drugwar Arsenal | Accept the $1 Challenge |