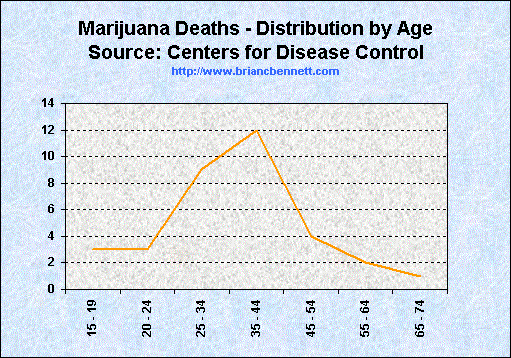
Source: Centers for Disease Control, CDC Wonder System
| Marijuana Induced Deaths by Age (1979 - 2002) | ||
|---|---|---|
| Age Group | Number of Deaths | % of Total |
| 15 - 19 | 3 | 9 |
| 20 - 24 | 3 | 9 |
| 25 - 34 | 9 | 26 |
| 35 - 44 | 12 | 34 |
| 45 - 54 | 5 | 14 |
| 55 - 64 | 2 | 6 |
| 65 - 74 | 1 | 3 |
| View by: | Deaths per Year | Gender & Race | Overview |