|
Source: Monitoring the Future, Vol I (2009), Table 5-1, pp.191-2
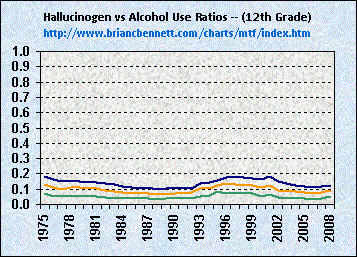
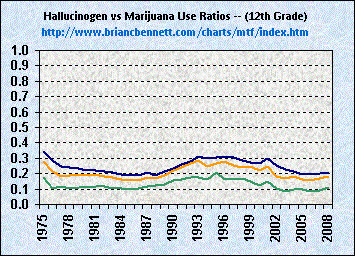
| Ratios of Hallucinogen Use vs Alcohol and Marijuana Use Among 12th Grade Students -- Lifetime Use | ||
|---|---|---|
| Year | vs Alcohol | vs Marijuana |
| 1975 | 0.18 | 0.34 |
| 1976 | 0.16 | 0.29 |
| 1977 | 0.15 | 0.25 |
| 1978 | 0.15 | 0.24 |
| 1979 | 0.15 | 0.23 |
| 1980 | 0.14 | 0.22 |
| 1981 | 0.14 | 0.22 |
| 1982 | 0.13 | 0.21 |
| 1983 | 0.13 | 0.21 |
| 1984 | 0.12 | 0.19 |
| 1985 | 0.11 | 0.19 |
| 1986 | 0.11 | 0.19 |
| 1987 | 0.11 | 0.21 |
| 1988 | 0.10 | 0.19 |
| 1989 | 0.10 | 0.22 |
| 1990 | 0.11 | 0.23 |
| 1991 | 0.11 | 0.26 |
| 1992 | 0.11 | 0.28 |
| 1993 | 0.14 | 0.31 |
| 1994 | 0.14 | 0.30 |
| 1995 | 0.16 | 0.30 |
| 1996 | 0.18 | 0.31 |
| 1997 | 0.18 | 0.30 |
| 1998 | 0.17 | 0.29 |
| 1999 | 0.17 | 0.28 |
| 2000 | 0.16 | 0.27 |
| 2001 | 0.18 | 0.30 |
| 2002 | 0.15 | 0.25 |
| 2003 | 0.14 | 0.23 |
| 2004 | 0.13 | 0.21 |
| 2005 | 0.12 | 0.20 |
| 2006 | 0.11 | 0.20 |
| 2007 | 0.12 | 0.20 |
| 2008 | 0.12 | 0.20 |
| Average | 0.14 | 0.24 |
Other Available Trend Comparisons
Click graphics to navigate
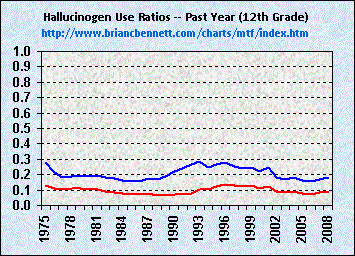
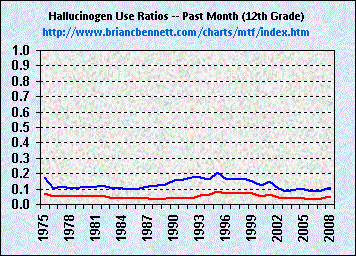
| Past Year Use Comparison | Past Month Use Comparison | Drug Use Trends vs Alcohol |
 |
 |
 |
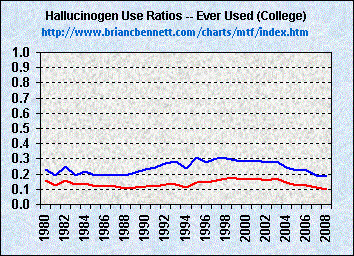
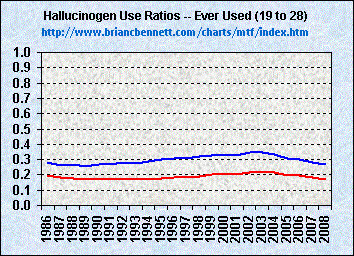
| Drug Use Trends vs Marijuana | College Student Hallucinogen Use Comparison | 19 to 28 Year Olds Hallucinogen Use Comparison |
 |
 |
 |
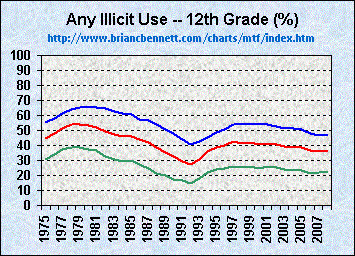
| Overview of 12th Grade Drug Use | Comparison Trends Across HS Students | Comparison Trends Across Young Adults |
 |
 |
 |