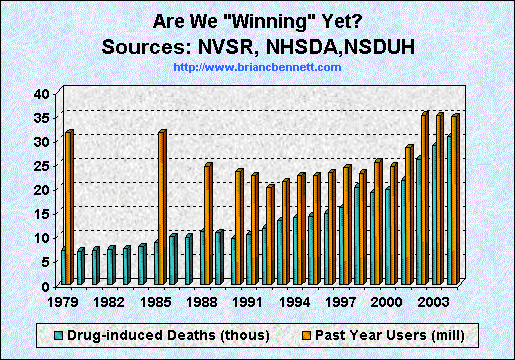

| Drug Use and Mortality 1979 - 2004 | |||
|---|---|---|---|
| Year | Past Year - Any Ilicit Use | Deaths | % of Users |
| 1979 | 31,485,000 | 7,101 | 0.023 |
| 1980 | -- | 6,900 | -- |
| 1981 | -- | 7,106 | -- |
| 1982 | -- | 7,310 | -- |
| 1983 | -- | 7,492 | -- |
| 1984 | -- | 7,892 | -- |
| 1985 | 31,488,000 | 8,663 | 0.028 |
| 1986 | -- | 9,976 | -- |
| 1987 | -- | 9,796 | -- |
| 1988 | 24,577,000 | 10,917 | 0.044 |
| 1989 | -- | 10,710 | -- |
| 1990 | 23,449,000 | 9,463 | 0.040 |
| 1991 | 22,612,000 | 10,388 | 0.046 |
| 1992 | 20,046,000 | 11,703 | 0.058 |
| 1993 | 21,402,000 | 13,275 | 0.062 |
| 1994 | 22,663,000 | 13,923 | 0.061 |
| 1995 | 22,662,000 | 14,218 | 0.063 |
| 1996 | 23,182,000 | 14,843 | 0.064 |
| 1997 | 24,189,000 | 15,973 | 0.066 |
| 1998 | 23,115,000 | 20,227 | 0.088 |
| 1999 | 25,402,000 | 19,102 | 0.075 |
| 2000 | 24,535,000 | 19,698 | 0.080 |
| 2001 | 28,409,000 | 21,683 | 0.076 |
| 2002 | 35,132,000 | 26,018 | 0.074 |
| 2003 | 34,993,000 | 28,783 | 0.082 |
| 2004 | 34,807,000 | 30,711 | 0.088 |
| 2005 | 35,041,000 | -- | -- |
Sources:
Mortality Data -- National Vital Statistics Reports
Use Data -- National Survey on Drug Use and Health & NHSDA
| truth: the Anti-drugwar | Anti-drugwar Arsenal | Accept the $1 Challenge |