
| truth: the Anti-drugwar | ||
| Homepage | Sitemap | |
| Trends by Drug Type | Trends by Pharmaceutical Type | Trends by Relative Popularity |

|

|
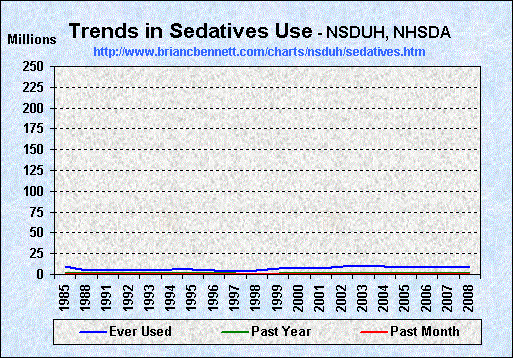
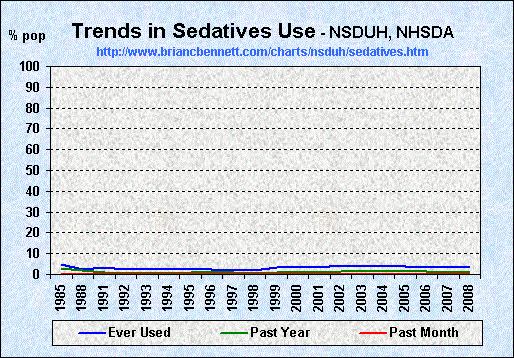
| Trends in Nonmedical Use of Sedatives Among Those 12 and Older (1985 - 2008) | |||||||
|---|---|---|---|---|---|---|---|
| Ever Used | Past Year | Past Month | |||||
| Year | Pop. 12 or Older | Number | Percent | Number | Percent | Number | Percent |
| 1985 | 192,605,000 | 9,260,000 | 4.8 | 2,209,000 | 1.1 | 964,000 | 0.5 |
| 1988 | 198,347,000 | 5,206,000 | 2.6 | 1,376,000 | 0.7 | 468,000 | 0.2 |
| 1991 | 202,859,000 | 6,482,000 | 3.2 | 946,000 | 0.5 | 468,000 | 0.2 |
| 1992 | 205,713,000 | 5,309,000 | 2.6 | 802,000 | 0.4 | 430,000 | 0.2 |
| 1993 | 207,199,000 | 5,320,000 | 2.6 | 702,000 | 0.3 | 315,000 | 0.2 |
| 1994 | 209,411,000 | 5,460,000 | 2.6 | 736,000 | 0.4 | 222,000 | 0.1 |
| 1995 | 211,532,000 | 5,760,000 | 2.7 | 666,000 | 0.3 | 421,000 | 0.2 |
| 1996 | 214,047,000 | 4,866,000 | 2.3 | 678,000 | 0.3 | 232,000 | 0.1 |
| 1997 | 216,206,000 | 4,080,000 | 1.9 | 638,000 | 0.3 | 187,000 | 0.1 |
| 1998 | 218,445,000 | 4,640,000 | 2.1 | 522,000 | 0.2 | 210,000 | 0.1 |
| 1999 | 221,123,000 | 7,747,000 | 3.5 | 631,000 | 0.3 | 229,000 | 0.1 |
| 2000 | 223,280,000 | 7,142,000 | 3.2 | 611,000 | 0.3 | 175,000 | 0.1 |
| 2001 | 225,636,000 | 7,477,000 | 3.3 | 806,000 | 0.4 | 306,000 | 0.1 |
| 2002 | 235,143,000 | 9,960,000 | 4.2 | 981,000 | 0.4 | 436,000 | 0.2 |
| 2003 | 237,682,000 | 9,510,000 | 4.0 | 831,000 | 0.3 | 294,000 | 0.1 |
| 2004 | 240,515,000 | 9,891,000 | 4.1 | 737,000 | 0.3 | 265,000 | 0.1 |
| 2005 | 243,220,000 | 8,982,000 | 3.7 | 750,000 | 0.3 | 272,000 | 0.1 |
| 2006 | 246,022,000 | 8,822,000 | 3.6 | 926,000 | 0.4 | 385,000 | 0.2 |
| 2007 | 247,845,000 | 8,396,000 | 3.4 | 864,000 | 0.3 | 346,000 | 0.1 |
| 2008 | 249,815,000 | 8,882,000 | 3.6 | 621,000 | 0.2 | 234,000 | 0.1 |
| truth: the Anti-drugwar | ||
| Homepage | Sitemap | |