
| truth: the Anti-drugwar | ||
| Homepage | Sitemap | |
| Use Trends by Drug Type | Overview of Trends in Popularity | Use Trends from Monitoring the Future |

|

|
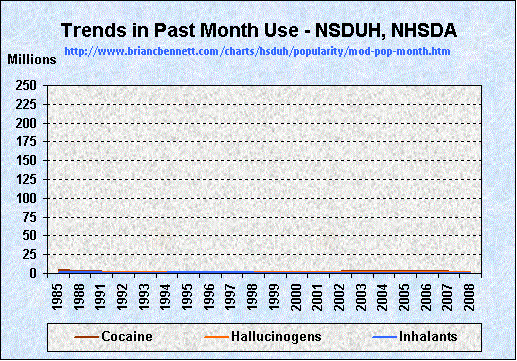
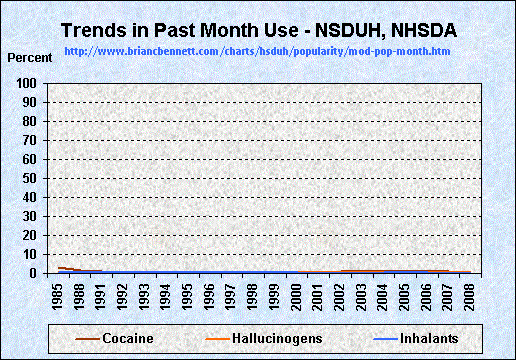
| Trends in Past Month Use of Moderately Popular Intoxicating Substances Among Those 12 and Older | |||||||
|---|---|---|---|---|---|---|---|
| Cocaine | Hallucinogens | Inhalants | |||||
| Year | Pop. 12 or Older | Number | Percent | Number | Percent | Number | Percent |
| 1985 | 192,605,000 | 5,686,000 | 3.0 | 2,257,000 | 1.2 | 1,156,000 | 0.6 |
| 1988 | 198,347,000 | 3,140,000 | 1.6 | 1,245,000 | 0.6 | 810,000 | 0.4 |
| 1991 | 202,859,000 | 2,032,000 | 1.0 | 1,115,000 | 0.5 | 806,000 | 0.4 |
| 1992 | 205,713,000 | 1,402,000 | 0.7 | 842,000 | 0.4 | 586,000 | 0.3 |
| 1993 | 207,199,000 | 1,404,000 | 0.7 | 826,000 | 0.4 | 589,000 | 0.3 |
| 1994 | 209,411,000 | 1,382,000 | 0.7 | 960,000 | 0.5 | 799,000 | 0.4 |
| 1995 | 211,532,000 | 1,453,000 | 0.7 | 1,469,000 | 0.7 | 896,000 | 0.4 |
| 1996 | 214,047,000 | 1,749,000 | 0.8 | 1,316,000 | 0.6 | 961,000 | 0.4 |
| 1997 | 216,206,000 | 1,505,000 | 0.7 | 1,632,000 | 0.8 | 883,000 | 0.4 |
| 1998 | 218,445,000 | 1,750,000 | 0.8 | 1,514,000 | 0.7 | 713,000 | 0.3 |
| 1999 | 221,123,000 | 1,552,000 | 0.7 | 922,000 | 0.4 | 570,000 | 0.3 |
| 2000 | 223,280,000 | 1,213,000 | 0.5 | 971,000 | 0.4 | 622,000 | 0.3 |
| 2001 | 225,636,000 | 1,676,000 | 0.7 | 1,264,000 | 0.6 | 539,000 | 0.2 |
| 2002 | 235,143,000 | 2,020,000 | 0.9 | 1,196,000 | 0.5 | 635,000 | 0.3 |
| 2003 | 237,682,000 | 2,281,000 | 1.0 | 1,042,000 | 0.4 | 570,000 | 0.2 |
| 2004 | 240,515,000 | 2,021,000 | 0.8 | 929,000 | 0.4 | 638,000 | 0.3 |
| 2005 | 243,220,000 | 2,397,000 | 1.0 | 1,088,000 | 0.4 | 611,000 | 0.3 |
| 2006 | 246,022,000 | 2,421,000 | 1.0 | 1,006,000 | 0.4 | 761,000 | 0.3 |
| 2007 | 247,845,000 | 2,075,000 | 0.8 | 996,000 | 0.4 | 616,000 | 0.2 |
| 2008 | 249,815,000 | 1,855,000 | 0.7 | 1,060,000 | 0.4 | 640,000 | 0.3 |
| truth: the Anti-drugwar | ||
| Homepage | Sitemap | |