|

|
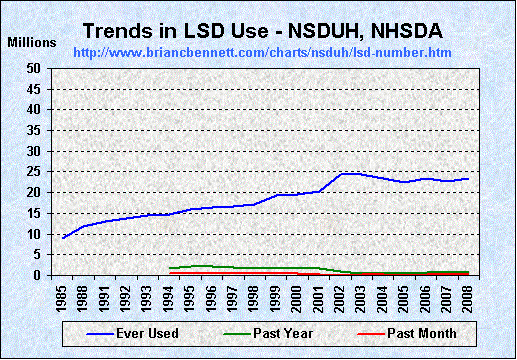
| Trends in LSD Use Among Those 12 and Older -- by Number of Users (1985 - 2008) | |||
|---|---|---|---|
| Ever Used | Past Year | Past Month | |
| 1985 | 8,889,000 | -- | -- |
| 1988 | 11,874,000 | -- | -- |
| 1991 | 13,045,000 | -- | -- |
| 1992 | 13,681,000 | -- | -- |
| 1993 | 14,471,000 | -- | -- |
| 1994 | 14,711,000 | 1,651,000 | 436,000 |
| 1995 | 15,852,000 | 2,108,000 | 548,000 |
| 1996 | 16,400,000 | 2,104,000 | 482,000 |
| 1997 | 16,760,000 | 1,956,000 | 474,000 |
| 1998 | 17,223,000 | 1,806,000 | 655,000 |
| 1999 | 19,215,000 | 1,905,000 | 482,000 |
| 2000 | 19,642,000 | 1,749,000 | 403,000 |
| 2001 | 20,202,000 | 1,612,000 | 320,000 |
| 2002 | 24,516,000 | 999,000 | 112,000 |
| 2003 | 24,424,000 | 558,000 | 133,000 |
| 2004 | 23,398,000 | 592,000 | 141,000 |
| 2005 | 22,433,000 | 563,000 | 104,000 |
| 2006 | 23,346,000 | 666,000 | 130,000 |
| 2007 | 22,656,000 | 620,000 | 145,000 |
| 2008 | 23,547,000 | 802,000 | 154,000 |
| truth: the Anti-drugwar | ||
| Homepage | Sitemap | |