|

|
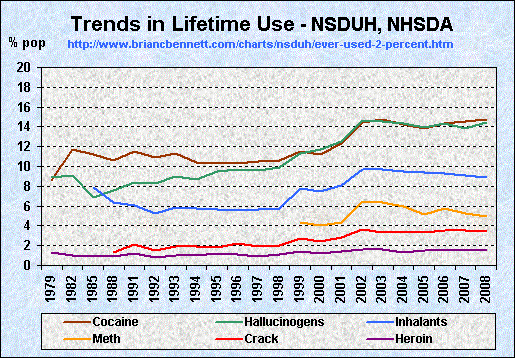
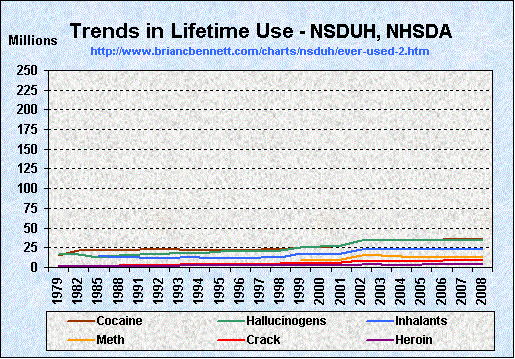
| Trends in Lifetime Substance Use Among Those 12 and Older -- by Percent of Population (1979 -2008) | |||||||
|---|---|---|---|---|---|---|---|
| Year | Pop. 12 or Older | Cocaine | Hallucinogens | Inhalants | Methamphetamines | Crack | Heroin |
| 1979 | 180,343,000 | 8.6 | 8.9 | -- | -- | -- | 1.3 |
| 1982 | 186,440,000 | 11.7 | 9.1 | -- | -- | -- | 1.0 |
| 1985 | 192,605,000 | 11.2 | 6.9 | 7.9 | -- | -- | 0.9 |
| 1988 | 198,347,000 | 10.6 | 7.6 | 6.4 | -- | 1.3 | 0.9 |
| 1991 | 202,859,000 | 11.5 | 8.4 | 6.1 | -- | 2.1 | 1.2 |
| 1992 | 205,713,000 | 10.9 | 8.3 | 5.3 | -- | 1.5 | 0.8 |
| 1993 | 207,199,000 | 11.3 | 9.0 | 5.9 | -- | 1.9 | 1.0 |
| 1994 | 209,411,000 | 10.4 | 8.7 | 5.8 | -- | 1.9 | 1.0 |
| 1995 | 211,532,000 | 10.3 | 9.5 | 5.7 | -- | 1.8 | 1.2 |
| 1996 | 214,047,000 | 10.3 | 9.7 | 5.6 | -- | 2.2 | 1.1 |
| 1997 | 216,206,000 | 10.5 | 9.6 | 5.7 | -- | 1.9 | 0.9 |
| 1998 | 218,445,000 | 10.6 | 9.9 | 5.8 | -- | 2.0 | 1.1 |
| 1999 | 221,123,000 | 11.5 | 11.3 | 7.8 | 4.3 | 2.7 | 1.4 |
| 2000 | 223,280,000 | 11.2 | 11.7 | 7.5 | 4.0 | 2.4 | 1.2 |
| 2001 | 225,636,000 | 12.3 | 12.5 | 8.1 | 4.3 | 2.8 | 1.4 |
| 2002 | 235,143,000 | 14.4 | 14.6 | 9.7 | 6.5 | 3.6 | 1.6 |
| 2003 | 237,682,000 | 14.7 | 14.5 | 9.7 | 6.4 | 3.3 | 1.6 |
| 2004 | 240,515,000 | 14.2 | 14.3 | 9.5 | 6.0 | 3.3 | 1.3 |
| 2005 | 243,220,000 | 13.8 | 13.9 | 9.4 | 5.2 | 3.3 | 1.5 |
| 2006 | 246,022,000 | 14.3 | 14.3 | 9.3 | 5.8 | 3.5 | 1.5 |
| 2007 | 247,845,000 | 14.5 | 13.8 | 9.1 | 5.3 | 3.5 | 1.5 |
| 2008 | 249,815,000 | 14.7 | 14.4 | 8.9 | 5.0 | 3.4 | 1.5 |
| truth: the Anti-drugwar | ||
| Homepage | Sitemap | |