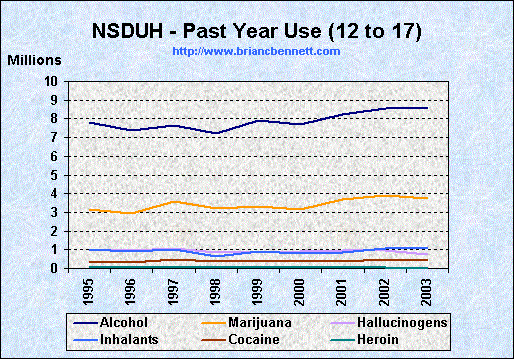
Source: National Survey on Drug Use and Health (2003)
| Past Year Drug Use Among 12 to 17 Year Olds (1 of 2) | ||||||
|---|---|---|---|---|---|---|
| Year | Alcohol | Any Illicit | Marijuana | Hallucinogens | Inhalants | Stimulants |
| 1995 | 7,795,008 | 3,997,440 | 3,153,536 | 1,021,568 | 1,021,568 | 333,120 |
| 1996 | 7,361,424 | 3,759,504 | 2,926,560 | 968,016 | 900,480 | 337,680 |
| 1997 | 7,665,980 | 4,238,836 | 3,562,426 | 1,059,709 | 992,068 | 383,299 |
| 1998 | 7,231,320 | 3,729,360 | 3,206,340 | 864,120 | 659,460 | 272,880 |
| 1999 | 7,912,223 | 4,594,194 | 3,294,826 | 881,714 | 904,917 | 487,263 |
| 2000 | 7,711,440 | 4,346,448 | 3,131,312 | 911,352 | 817,880 | 560,832 |
| 2001 | 8,223,296 | 5,045,562 | 3,687,141 | 970,300 | 849,013 | 533,665 |
| 2002 | 8,564,000 | 5,494,000 | 3,905,000 | 945,000 | 1,078,000 | 650,000 |
| 2003 | 8,573,285 | 5,448,910 | 3,749,250 | 774,845 | 1,124,775 | 574,885 |
| Past Year Drug Use Among 12 to 17 Year Olds (2 of 2) | ||||||
|---|---|---|---|---|---|---|
| Year | Tranquilizers | Cocaine | LSD | Sedatives | PCP | Heroin |
| 1995 | 133,248 | 377,536 | 710,656 | 111,040 | 177,664 | 133,248 |
| 1996 | 225,120 | 315,168 | 630,336 | 90,048 | 157,584 | 67,536 |
| 1997 | 293,111 | 496,034 | 653,863 | 90,188 | 112,735 | 67,641 |
| 1998 | 250,140 | 386,580 | 591,240 | 136,440 | 136,440 | 68,220 |
| 1999 | 371,248 | 371,248 | 556,872 | 116,015 | 92,812 | 69,609 |
| 2000 | 373,888 | 397,256 | 514,096 | 116,840 | 116,840 | 46,736 |
| 2001 | 412,378 | 363,863 | 460,893 | 72,773 | 121,288 | 48,515 |
| 2002 | 568,000 | 508,000 | 314,000 | 138,000 | 110,000 | 51,000 |
| 2003 | 574,885 | 449,910 | 149,970 | 124,975 | 99,980 | 24,995 |