Click graphics to navigate
| Any Illicit Use Within Cohort -- High School Senior Classes of 1995 through 2008 | ||
|---|---|---|
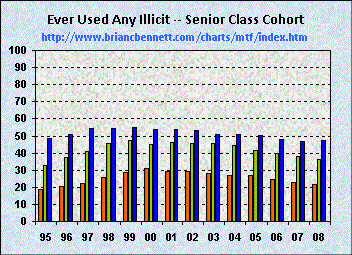
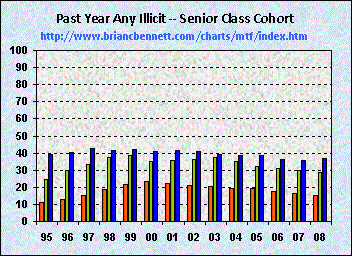
| Lifetime | Past Year | Past Month |
 |
 |
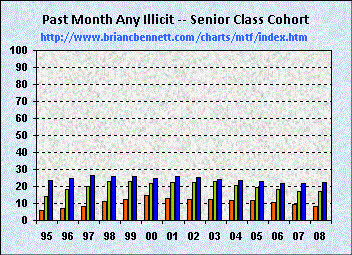 |
Source: Monitoring the Future, 2009, Tables 5-5a, 5-5b and 5-5c, pp.202-13
| Trends in Use of Any Illicit Drug Within HS Senior Cohorts -- Classes of 1995 through 2008 | |||||||||
|---|---|---|---|---|---|---|---|---|---|
| Lifetime | Past Year | Past Month | |||||||
| Class of: | 8th Grade | 10th Grade | 12th Grade | 8th Grade | 10th Grade | 12th Grade | 8th Grade | 10th Grade | 12th Grade |
| 1995 | 18.7 | 32.8 | 48.4 | 11.3 | 24.7 | 39.0 | 5.7 | 14.0 | 23.8 |
| 1996 | 20.6 | 37.4 | 50.8 | 12.9 | 30.0 | 40.2 | 6.8 | 18.5 | 24.6 |
| 1997 | 22.5 | 40.9 | 54.3 | 15.1 | 33.3 | 42.4 | 8.4 | 20.2 | 26.2 |
| 1998 | 25.7 | 45.4 | 54.1 | 18.5 | 37.5 | 41.4 | 10.9 | 23.2 | 25.6 |
| 1999 | 28.5 | 47.3 | 54.7 | 21.4 | 38.5 | 42.1 | 12.4 | 23.0 | 25.9 |
| 2000 | 31.2 | 44.9 | 54.0 | 23.6 | 35.0 | 40.9 | 14.6 | 21.5 | 24.9 |
| 2001 | 29.4 | 46.2 | 53.9 | 22.1 | 35.9 | 41.4 | 12.9 | 22.1 | 25.7 |
| 2002 | 29.0 | 45.6 | 53.0 | 21.0 | 36.4 | 41.0 | 12.1 | 22.5 | 25.4 |
| 2003 | 28.3 | 45.6 | 51.1 | 20.5 | 37.2 | 39.3 | 12.2 | 22.7 | 24.1 |
| 2004 | 26.8 | 44.6 | 51.1 | 19.5 | 34.8 | 38.8 | 11.9 | 20.8 | 23.4 |
| 2005 | 26.8 | 41.4 | 50.4 | 19.5 | 32.0 | 38.4 | 11.7 | 19.5 | 23.1 |
| 2006 | 24.5 | 39.8 | 48.2 | 17.7 | 31.1 | 36.5 | 10.4 | 18.3 | 21.5 |
| 2007 | 22.8 | 38.2 | 46.8 | 16.1 | 29.8 | 35.9 | 9.7 | 17.3 | 21.9 |
| 2008 | 21.5 | 36.1 | 47.4 | 15.2 | 28.7 | 36.6 | 8.4 | 16.8 | 22.3 |