Click graphics to navigate
| Alcohol Use Within Cohort -- High School Senior Classes of 1995 through 2008 | ||
|---|---|---|
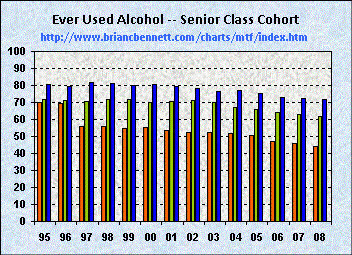
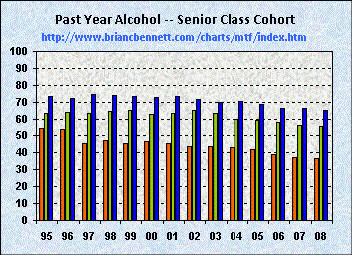
| Lifetime | Past Year | Past Month |
 |
 |
 |
Source: Monitoring the Future, 2009, Tables 5-5a, 5-5b and 5-5c, pp.202-13
| Lifetime | Past Year | Past Month | |||||||
| Class of: | 8th Grade | 10th Grade | 12th Grade | 8th Grade | 10th Grade | 12th Grade | 8th Grade | 10th Grade | 12th Grade |
| 1995 | 70.1 | 71.6 | 80.7 | 54.0 | 63.4 | 73.7 | 25.1 | 38.2 | 51.3 |
| 1996 | 69.3 | 71.1 | 79.2 | 53.7 | 63.9 | 72.5 | 26.1 | 39.2 | 50.8 |
| 1997 | 55.7 | 70.5 | 81.7 | 45.4 | 63.5 | 74.8 | 24.3 | 38.8 | 52.7 |
| 1998 | 55.8 | 71.8 | 81.4 | 46.8 | 65.0 | 74.3 | 25.5 | 40.4 | 52.0 |
| 1999 | 54.5 | 72.0 | 80.0 | 45.3 | 65.2 | 73.8 | 24.6 | 40.1 | 51.0 |
| 2000 | 55.3 | 69.8 | 80.3 | 46.5 | 62.7 | 73.2 | 26.2 | 38.8 | 50.0 |
| 2001 | 53.8 | 70.6 | 79.7 | 45.5 | 63.7 | 73.3 | 24.5 | 40.0 | 49.8 |
| 2002 | 52.5 | 71.4 | 78.4 | 43.7 | 65.3 | 71.5 | 23.0 | 41.0 | 48.6 |
| 2003 | 52.1 | 70.1 | 76.6 | 43.5 | 63.5 | 70.1 | 24.0 | 39.0 | 47.5 |
| 2004 | 51.7 | 66.9 | 76.8 | 43.1 | 60.0 | 70.6 | 22.4 | 35.4 | 48.0 |
| 2005 | 50.5 | 66.0 | 75.1 | 41.9 | 59.3 | 68.6 | 21.5 | 35.4 | 47.0 |
| 2006 | 47.0 | 64.2 | 72.7 | 38.7 | 58.2 | 66.5 | 19.6 | 35.2 | 45.3 |
| 2007 | 45.6 | 63.2 | 72.2 | 37.2 | 56.7 | 66.4 | 19.7 | 33.2 | 44.4 |
| 2008 | 43.9 | 61.5 | 71.9 | 36.7 | 55.8 | 65.5 | 18.6 | 33.8 | 43.1 |