Monitoring the Future -- Alcohol Use
Trends Among 12th Grade Students (1975 - 2008)
Source: Monitoring the Future (2009), Vol I, Tables 5-1, 5-2, and 5-3, pp.191-199
| truth: the Anti-drugwar | ||
| Homepage | Sitemap | |
Source: Monitoring the Future (2009), Vol I, Tables 5-1, 5-2, and 5-3, pp.191-199
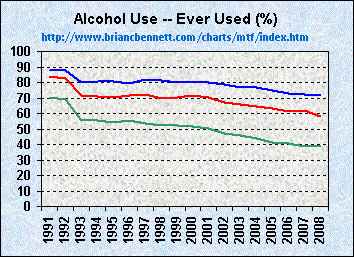
| Trends in Alcohol Use Among 12th Grade Students (1975 - 2008) | |||
|---|---|---|---|
| Year | Lifetime | Past Year | Past Month |
| 1975 | 90.4 | 84.8 | 68.2 |
| 1976 | 91.9 | 85.7 | 68.3 |
| 1977 | 92.5 | 87.0 | 71.2 |
| 1978 | 93.1 | 87.7 | 72.1 |
| 1979 | 93.0 | 88.1 | 71.8 |
| 1980 | 93.2 | 87.9 | 72.0 |
| 1981 | 92.6 | 87.0 | 70.7 |
| 1982 | 92.8 | 86.8 | 69.7 |
| 1983 | 92.6 | 87.3 | 69.4 |
| 1984 | 92.6 | 86.0 | 67.2 |
| 1985 | 92.2 | 85.6 | 65.9 |
| 1986 | 91.3 | 84.5 | 65.3 |
| 1987 | 92.2 | 85.7 | 66.4 |
| 1988 | 92.0 | 85.3 | 63.9 |
| 1989 | 90.7 | 82.7 | 60.0 |
| 1990 | 89.5 | 80.6 | 57.1 |
| 1991 | 88.0 | 77.7 | 54.0 |
| 1992 | 87.5 | 76.8 | 51.3 |
| 1993 | 80.0 | 72.7 | 48.6 |
| 1994 | 80.4 | 73.0 | 50.1 |
| 1995 | 80.7 | 73.7 | 51.3 |
| 1996 | 79.2 | 72.5 | 50.8 |
| 1997 | 81.7 | 74.8 | 52.7 |
| 1998 | 81.4 | 74.3 | 52.0 |
| 1999 | 80.0 | 73.8 | 51.0 |
| 2000 | 80.3 | 73.2 | 50.0 |
| 2001 | 79.7 | 73.3 | 49.8 |
| 2002 | 78.4 | 71.5 | 48.6 |
| 2003 | 76.6 | 70.1 | 47.5 |
| 2004 | 76.8 | 70.6 | 48.0 |
| 2005 | 75.1 | 68.6 | 47.0 |
| 2006 | 72.7 | 66.5 | 45.3 |
| 2007 | 72.2 | 66.4 | 44.4 |
| 2008 | 71.9 | 65.5 | 43.1 |
| Averages: | 85.2 | 78.5 | 57.8 |
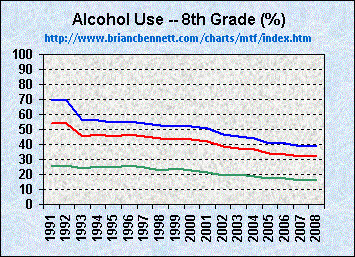
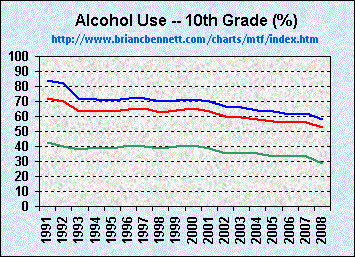
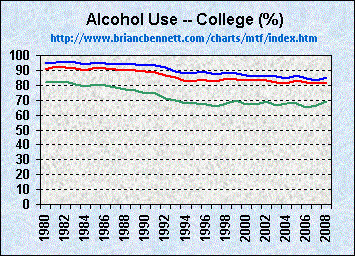
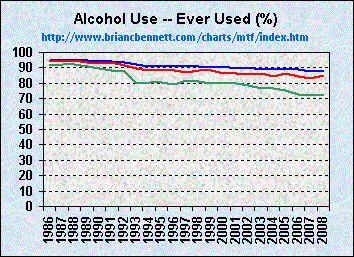
| 8th Grade Students | 10th Grade Students | College Students |
 |
 |
 |
| Age 19 to 28 | Comparison of Trends Among School Age Youth | Comparison of Trends Among Young Adults |
 |
 |
 |
| truth: the Anti-drugwar | ||
| Homepage | Sitemap | |