truth: the Anti-drugwar
Homepage Sitemap

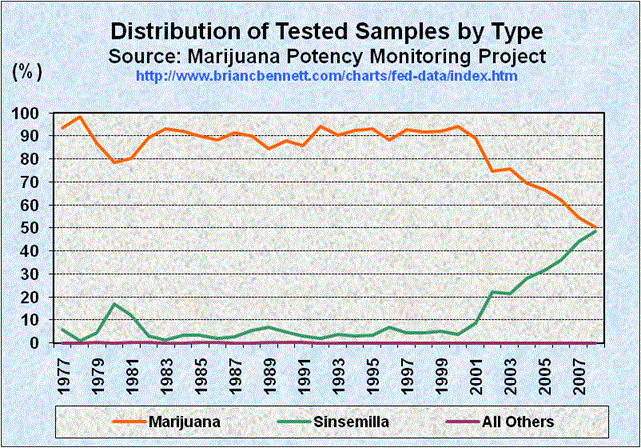
Distribution of Seized Marijuana Samples (1980 - 2008)

Distribution of Tested Cannabis Samples by Product Type
Year Marijuana Sinsemilla All Others
1980 78.43 16.99 0.34
1981 80.38 11.92 0.08
1982 89.32 2.87 0.08
1983 93.17 1.38 0.05
1984 92.05 3.22 0.05
1985 89.83 3.23 0.07
1986 88.17 2.06 0.10
1987 91.24 2.53 0.06
1988 90.01 5.38 0.05
1989 84.51 6.76 0.09
1990 87.73 4.83 0.07
1991 85.72 2.99 0.11
1992 94.24 2.15 0.04
1993 90.38 3.67 0.06
1994 92.38 3.17 0.04
1995 93.09 3.45 0.03
1996 88.21 6.90 0.05
1997 92.62 4.52 0.03
1998 91.69 4.46 0.04
1999 92.17 5.12 0.03
2000 94.03 3.63 0.02
2001 88.95 8.72 0.02
2002 74.79 22.07 0.03
2003 75.81 21.55 0.03
2004 69.59 28.03 0.02
2005 66.53 31.57 0.02
2006 62.00 36.15 0.02
2007 54.34 44.10 0.02
2008 50.16 48.61 0.01

Sources: University of Mississippi, Marijuana Potency Monitoring Project*

* The Marijuana Potency Monitoring project is sponsored by the US National Institute on Drug Abuse. The sources of the numbers quoted here are as follows:
  1. ElSohly, M.A., et al "The Potency of Confiscated Marijuana, Hashish, and Hash Oil Over a Ten-Year Period," Journal of Forensic Sciences, Volume 29, No. 2, April 1984, pp. 500-514

  2. ElSohly M.A., et al "Potency Trends of delta-9 THC and Other Cannabinoids in Confiscated Marijuana from 1980-1997, Journal of Forensic Sciences, Volume 45, No. 1, 2000, pp. 24-30

  3. ElSohly M.A. National Center for Natural Products Research, School of Pharmacy, University of Mississippi, Quarterly Report, Potency Monitoring Project, Report #104, Dec 16, 2008 - Mar 15, 2009


truth: the Anti-drugwar
Homepage Sitemap