
| truth: the Anti-drugwar | ||
| Homepage | Sitemap | |
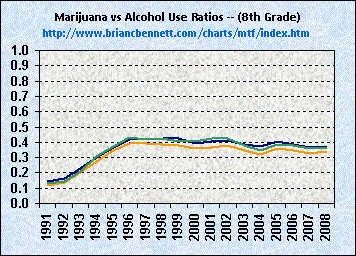
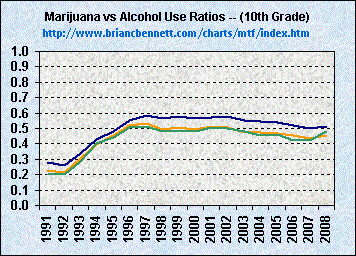
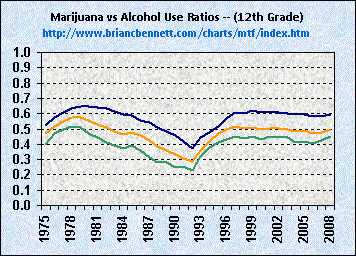
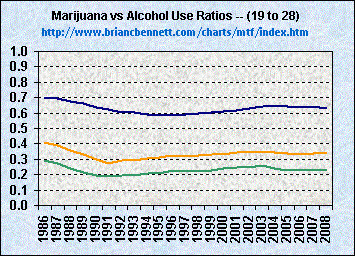
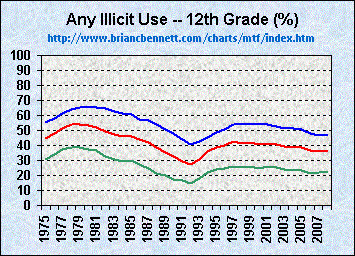
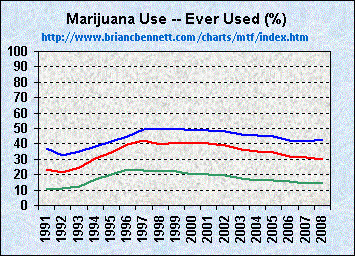
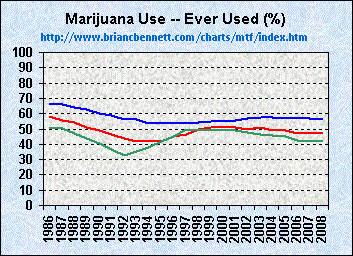
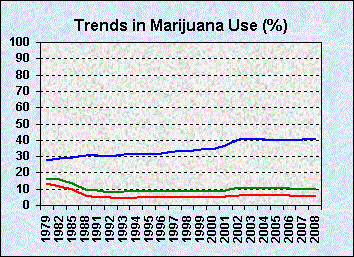
| This page serves as a convenient navigation aid for finding data tables and large graphics depicting trends in the use of various drugs compared to the use of alcohol and to marijuana for each of the demographic groups covered by the annual Monitoring the Future study. As you navigate the site, any small graphic without legends is intended primarily for navigation purposes, thus you can always click any such graphic to move through different parts of the available data and the site contents. |
Click Graphics to Navigate
| 8th Grade | 10th Grade | 12th Grade |
|
|
|
|
| College Students | Age 19 to 28 | Baseline MTF Drug Use Data |
|
|
|
|
| Comparisons Across School Age Demographics | Comparisons Across Young Adult Demographics | Trends Among Those Age 12 and Older |
 |
 |
 |
| truth: the Anti-drugwar | ||
| Homepage | Sitemap | |