|
|
Source: Monitoring the Future, Vol I (2009), Table 5-5b, pp. 202-204
| Trends in Hallucinogen Use Among High School Students -- Lifetime Use (1991 - 2008) | |||
|---|---|---|---|
| Year | 12th Grade | 10th Grade | 8th Grade |
| 1991 | 9.6 | 6.1 | 3.2 |
| 1992 | 9.2 | 6.4 | 3.8 |
| 1993 | 10.9 | 6.8 | 3.9 |
| 1994 | 11.4 | 8.1 | 4.3 |
| 1995 | 12.7 | 9.3 | 5.2 |
| 1996 | 14.0 | 10.5 | 5.9 |
| 1997 | 15.1 | 10.5 | 5.4 |
| 1998 | 14.1 | 9.8 | 4.9 |
| 1999 | 13.7 | 9.7 | 4.8 |
| 2000 | 13.0 | 8.9 | 4.6 |
| 2001 | 14.7 | 8.9 | 5.2 |
| 2002 | 12.0 | 7.8 | 4.1 |
| 2003 | 10.6 | 6.9 | 4.0 |
| 2004 | 9.7 | 6.4 | 3.5 |
| 2005 | 8.8 | 5.8 | 3.8 |
| 2006 | 8.3 | 6.1 | 3.4 |
| 2007 | 8.4 | 6.4 | 3.1 |
| 2008 | 8.7 | 5.5 | 3.3 |
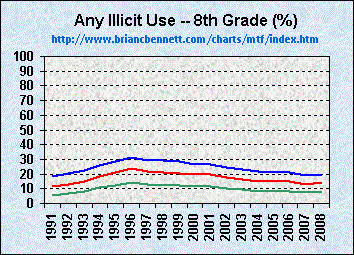
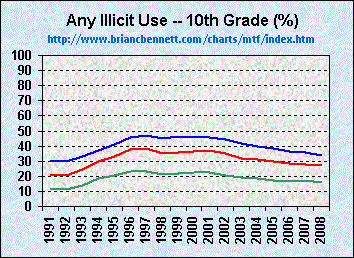
Drug Use Trends for Each Demographic Group
Click graphics to navigate
| 8th Grade Students | 10th Grade Students | 12th Grade Students |
 |
 |
 |