|
Source: Monitoring the Future, Vols I & II (2009)
| Trends in Alcohol Use Among Young Adults -- Lifetime Use (1986 - 2008) | |||
|---|---|---|---|
| Year | Ages 19 to 28 | College Students | 12th Grade Students |
| 1986 | 94.8 | 94.9 | 91.3 |
| 1987 | 94.9 | 94.1 | 92.2 |
| 1988 | 94.8 | 94.9 | 92.0 |
| 1989 | 94.5 | 93.7 | 90.7 |
| 1990 | 94.3 | 93.1 | 89.5 |
| 1991 | 94.1 | 93.6 | 88.0 |
| 1992 | 93.4 | 91.8 | 87.5 |
| 1993 | 92.1 | 89.3 | 80.0 |
| 1994 | 91.2 | 88.2 | 80.4 |
| 1995 | 91.6 | 88.5 | 80.7 |
| 1996 | 91.2 | 88.4 | 79.2 |
| 1997 | 90.7 | 87.3 | 81.7 |
| 1998 | 90.6 | 88.5 | 81.4 |
| 1999 | 90.2 | 88.0 | 80.0 |
| 2000 | 90.7 | 86.6 | 80.3 |
| 2001 | 89.9 | 86.1 | 79.7 |
| 2002 | 90.2 | 86.0 | 78.4 |
| 2003 | 89.0 | 86.2 | 76.6 |
| 2004 | 89.4 | 84.6 | 76.8 |
| 2005 | 89.9 | 86.1 | 79.7 |
| 2006 | 90.2 | 86.0 | 78.4 |
| 2007 | 89.0 | 86.2 | 76.6 |
| 2008 | 89.4 | 84.6 | 76.8 |
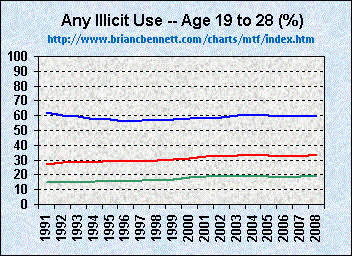
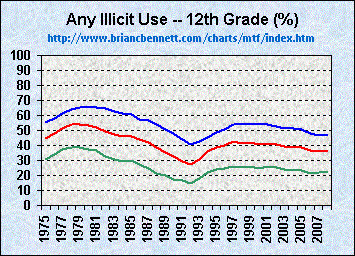
Drug Use Trends for Each Demographic Group
Click graphics to navigate
| 19 to 28 Year Olds | College Students | 12th Grade Students |
 |
 |
 |